28 December 2024 : Daily Current Affairs
1. Climate disasters in 2024 wreaked havoc worldwide, causing losses
(Source – The Hindu, International Edition – Page No. – 4)
| Context |
|
Overview of 2024 Climate Disasters
- 2024 witnessed unprecedented climate disasters across diverse regions, from impoverished areas to prosperous cities.
- It was the hottest year on record, with rising atmospheric and ocean temperatures fueling extreme weather events.
- Nearly every analyzed disaster was exacerbated by climate change, marking a dangerous new era of climate impacts.
Impacts of Rising Temperatures
- Extreme heat led to severe casualties, particularly during events like pilgrimages and in countries like Thailand, India, and the U.S.
- High temperatures intensified droughts, wildfires, and hurricanes.
Flooding and Heavy Rainfall
- Warmer oceans and increased evaporation resulted in heavy rainfall and flooding across continents.
- Countries in Africa, Asia, and the Americas experienced historic floods, displacing millions and causing significant casualties.
Hurricanes and Cyclones
- Warmer ocean surfaces increased the energy and destructive potential of tropical cyclones and hurricanes.
- Regions like the Caribbean, the Philippines, and Mayotte faced multiple devastating storms.
Economic Toll and Consequences
- Global damage from extreme weather reached $310 billion.
- These disasters caused loss of life, displaced populations, and worsened poverty, with long-term impacts remaining immeasurable.
| PYQ: The frequency of urban floods due to high intensity rainfall is increasing over the years. Discussing the reasons for urban floods. highlight the mechanisms for preparedness to reduce the risk during such events. (200 words/12.5m) (UPSC CSE (M) GS-3 2016) |
| Practice Question: Examine the role of rising temperatures and warming oceans in intensifying climate disasters. Discuss the socio-economic consequences of extreme weather events in vulnerable regions and suggest measures to mitigate their impacts. (150 Words /10 marks) |
2. HCES 2023-24: Rising Food Expenditure, Narrowing Urban-Rural Gap, and Declining Inequality Highlight India’s Shifting Consumption Trends
(Source: Indian Express; Section: Cover Page; Page: 01)
| Topic: GS3 – Indian Economy |
| Context: |
|
Analysis of News:
About Household Consumption Expenditure Survey (HCES)
- Objective: It is designed to collect information on the consumption of goods and services by households.
- Conducted by: NSSO under the Ministry of Statistics and Programme Implementation (MoSPI) has been conducting HCES at regular intervals.
- Initially, the NSSO was conducted HCES every year (starting 1950-51). However, since its 26th round, the survey has been conducted roughly every 5 years. (The 2017-18 Survey was discarded by the government citing ‘Data Quality’ issues.)
- Utility of HCES: The data is useful for understanding consumption and expenditure patterns, standard of living and well-being of households.
- It can play a key role in reviewing critical economic indicators, including GDP, poverty levels, and Consumer Price Inflation.
Rising Food Expenditure Trends
- The Household Consumption Expenditure Survey (HCES) 2023-24 reveals a reversal in the declining trend of food expenditure’s share in monthly consumption.
- Rural households allocated 47.04% of their expenditure to food in 2023-24, up from 46.38% in 2022-23, while urban households increased their share from 39.17% to 39.68%.
- This rise is likely driven by higher food prices, given the nominal figures.
Narrowing Urban-Rural Gap in Spending
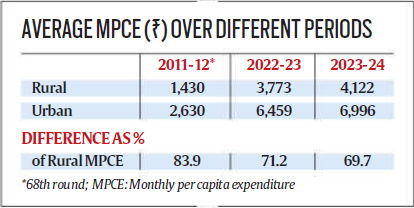
- The gap in average monthly consumption expenditure between rural and urban households continued to shrink, reaching 69.7% in 2023-24, compared to 71.2% in 2022-23 and 83.9% in 2011-12.
- Rural per capita spending increased by 9.3% to ₹4,122, outpacing urban spending growth, which rose to ₹6,996.
- This reflects faster consumption growth in rural areas, contrasting with a moderation in urban consumption.
Consumption Patterns Across Income Groups
- Consumption spending rose across all income groups except the top 5% of rural and urban populations, whose spending declined.
- The bottom 20% recorded the highest percentage increase in spending, with rural spending rising by 19.2% and urban spending by 18%.
- Experts attribute these trends to potential methodological changes or variations in respondent data, necessitating further validation.
Reduced Consumption Inequality
- The Gini coefficient for consumption inequality declined significantly, from 0.266 to 0.237 in rural areas and from 0.314 to 0.284 in urban areas.
- This indicates a more equitable distribution of consumption growth across income groups, driven partly by social welfare programmes that bolstered spending among lower-income households.
Food and Non-Food Expenditure Breakdown
- The share of expenditure on cereals, beverages, and processed foods rose slightly in rural and urban households.
- Non-food expenditure accounted for 52.96% and 60.32% of spending in rural and urban areas, respectively, with key contributors including conveyance, medical expenses, and rent.
Regional Disparities in Spending
- State-wise data highlight disparities in consumption patterns, with higher per capita spending in western and southern states like Maharashtra, Kerala, and Gujarat, and lower spending in eastern and central states like Bihar, Odisha, and Uttar Pradesh.
- Rajasthan presented a unique case with higher rural spending but lower urban spending compared to the national average.
Conclusion: Insights from Consumption Trends
- The HCES 2023-24 underscores shifting consumption dynamics, with rural areas driving growth, declining inequality, and changing food and non-food expenditure patterns.
- While the data reflects positive trends in inclusivity, regional and income-based disparities warrant targeted policy interventions to ensure sustained and balanced growth.
| Significance of Consumer Expenditure Survey (CES) |
|
| Practice Question: The Household Consumption Expenditure Survey (HCES) 2023-24 highlights rising food expenditure, narrowing rural-urban disparities, and declining consumption inequality in India. Discuss the implications of these trends for economic policy-making and regional development. (250 words/15 m) |
3. Forest and Tree Cover Grows, Fire Incidents Fall
(Source – https://pib.gov.in/PressReleseDetail.aspx?PRID=2088477®=3&lang=1 )
| Topic: GS3 – Environment |
| Context |
|
Introduction
- Forests play a critical role in combating climate change by absorbing carbon, preserving biodiversity, and providing essential ecosystem services like clean air and water.
- India’s positive shift in forest conservation is reflected in the India State of Forest Report (ISFR) 2023.
- The report highlights that Forest and Tree cover now spans 827,357 square kilometers, accounting for 25.17% of India’s land area, including 21.76% forest cover and 3.41% tree cover.
ISFR 2023: A Snapshot of India’s Forests
- The ISFR is a biennial assessment conducted by the Forest Survey of India (FSI) using satellite and field data, with the first report published in 1987.
- The 2023 edition consists of two volumes:
- Volume-I: National-level assessment, covering forest cover, mangroves, forest fires, carbon stock, and decadal changes.
- Volume II: State/UT-level data on forest cover and field inventories.
Growth in Forest Cover
- Forest cover in India increased from 698,712 km² in 2013 to 715,343 km² in 2023.
- Fire incidents decreased significantly, with 203,544 fire hotspots in 2023-24 compared to 223,333 in 2021-22.
- India achieved a carbon sink of 30.43 billion tonnes of CO2 equivalent, an additional 2.29 billion tonnes since 2005, nearing its 2030 NDC target.



Government Schemes and Initiatives
- The Forest Survey of India (FSI) improved forest monitoring through upgraded mapping systems, a Forest Fire Alert System, and digitization of forest boundaries in 25 States/UTs.
- Key schemes include:
- Green India Mission (GIM): Enhanced forest cover through restoration and expansion, with Rs. 944.48 crore released to 17 States and 1 UT.
- Nagar Van Yojana (NVY): Developed green spaces in urban areas, with Rs. 431.77 crore allocated for 546 projects.
- School Nursery Yojana (SNY): Promoted tree planting in schools, with 743 projects sanctioned and Rs. 4.80 crore allocated.
- Mangrove Initiative (MISHTI): Restored mangroves along coasts, with Rs. 17.96 crore allocated to several states.
- Compensatory Afforestation Fund Management (CAMPA): Mitigated forest loss due to non-forest activities.
- Afforestation Targets: Annual targets set under the Twenty-Point Programme with a mix of central and state schemes.
- Awareness Campaigns: Tree planting promoted during events like Van Mahotsav and Wildlife Week.
Legal Framework for Forest and Wildlife Protection
- India’s forest and wildlife conservation is governed by key laws, including:
- Indian Forest Act, 1927
- Van Sanrakshan Evam Samvardhan Adhiniyam, 1980
- Wildlife (Protection) Act, 1972
- State-specific laws and Tree Preservation Acts ensure urban and rural tree protection.
People’s Connection with Nature
- Individual contributions like those of Padma Shri Tulsi Gowda demonstrate the importance of community involvement.
- Known as the “Mother of Trees,” she dedicated over 60 years to planting lakhs of trees, creating lush forests from barren lands.
Conclusion
- India is advancing towards environmental sustainability through impressive growth in forest and tree cover, reduced fire incidents, and agroforestry expansion.
- Innovative government initiatives and community participation highlight India’s commitment to conservation and restoration.
- These collective efforts pave the way for a greener, healthier future for all.
| PYQ: Examine the status of forest resources of India and its resultant impact on climate change. (250 words/15m) (UPSC CSE (M) GS-1 2020) |
| Practice Question: Discuss the key findings of the India State of Forest Report (ISFR) 2023 and evaluate the effectiveness of government schemes in enhancing forest and tree cover while addressing climate change challenges. (250 Words /15 marks) |
Prelims Facts
1. UNSC authorizes new peacekeeping mission in Somalia
(Source – The Hindu, International Edition – Page No. – 4)
| Context |
|

Analysis of the news:
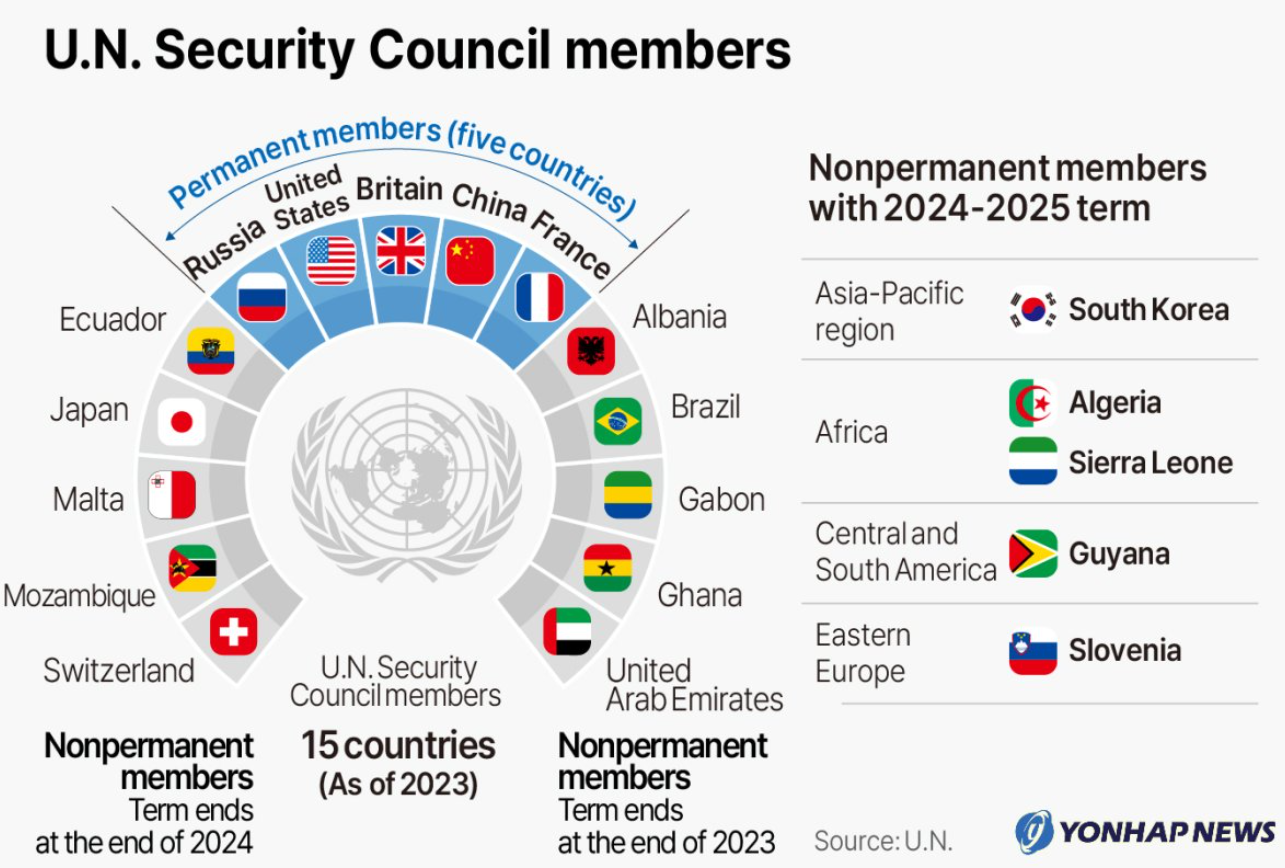
- The UN Security Council authorized the African Union Stabilisation and Support Mission in Somalia (AUSSOM), replacing a larger AU anti-terrorism operation starting January 1, 2025.
- Somalia’s security has relied on foreign resources since Ethiopia’s 2006 invasion, which ousted an Islamist-led administration but triggered a deadly insurgency.
- The European Union and United States, key funders of AU forces, sought to reduce peacekeeper numbers due to concerns over long-term financing and sustainability.
- Negotiations over the new force were challenging, highlighting funding complexities.
- The United States abstained from the vote, citing funding concerns, while 14 other members supported the resolution.
| UN Security Council |
|
2. The curious case of December: Why the 12th month is the roman word for 10
(Source: Indian Express; Section: Explained; Page: 18)
| Context: |
|
Analysis of News:
Origins of the Roman Calendar
Structure and Nomenclature:
- The Roman calendar, introduced by Romulus in 738 BC, comprised 304 days divided into 10 months, starting in March and ending in December.
- The last six months were numerically named: Quintilis (5th), Sextilis (6th), September (7th), October (8th), November (9th), and December (10th).
Uncounted Winter Months:
- Winter months were left unnamed and excluded from the calendar due to their perceived irrelevance to agrarian and military activities.
- This omission led to misalignment with the solar year, causing disruptions in seasonal and religious cycles.
Who was Numa Pompilius?
- Numa Pompilius was the second king of ancient Rome, succeeding Romulus, the legendary founder of Rome. He reigned from 715 to 673 BCE and is traditionally credited with many foundational aspects of Roman religion and social structure.
- Numa is best known for his reforms in the Roman calendar, which included the introduction of January and February, creating a more accurate alignment with the lunar and solar cycles.
- He also instituted various religious practices and priesthoods, establishing the Roman religious framework, and is often regarded as a wise and pious ruler.
Reforms by Numa Pompilius
To address the misalignment:
- Addition of January and February:
Numa introduced two new months—January and February—in 713 BC, appending them to the end of the calendar. January was dedicated to Janus, the god of transitions, while February derived its name from purification rituals. - Superstition and Odd Numbers:
Numa’s reforms aimed to avoid even numbers, considered inauspicious. Most months were reduced to 29 days, except February, which retained 28 days as the “unlucky” month.
Political Interference and the Julian Reform
- Intercalation and Manipulation:
To realign the calendar with the solar year, an extra month, Mercedonius, was occasionally added. Political authorities often exploited this for personal or political gain, worsening inconsistencies. - Julius Caesar’s Overhaul:
By 46 BC, Julius Caesar introduced the Julian calendar, advised by Sosigenes. It standardized the year at 365¼ days and corrected discrepancies by extending 46 BC to 445 days. February retained its uneven length, and leap years were introduced.
Gregorian Calendar Adjustment
- By the mid-1500s, errors in the Julian calendar caused seasonal drift. Pope Gregory XIII reformed it in 1582, aligning it with astronomical observations and adjusting by 10 days.
- The Gregorian calendar became the global standard, though Britain adopted it only in 1752.
Legacy of Numerical Names
Despite political efforts to rename months for emperors, the numerical misalignments persisted:
- Quintilis became July (after Julius Caesar), and Sextilis became August (after Augustus Caesar).
- September, October, November, and December remained unchanged due to tradition’s stronghold on daily life and cultural rhythms.
For more such UPSC related Current Affairs, Check Out– 27 December 2024 : Daily Current Affairs


