CHAPTER 2 – MONETARY MANAGEMENT AND FINANCIAL INTERMEDIATION: STABILITY IS THE WATCHWORD
| Objectives of Monetary Policy |
|
The primary objective of monetary policy is to maintain price stability while keeping in mind the objective of growth. Various instruments of monetary policy, viz. cash reserve ratio (CRR) and statutory liquidity ratio (SLR) of banks, open market operations of the Central Bank, and imposition of credit ceilings, etc., are used by the central bank in the direction of this overall objective. |
Monetary Developments
Monetary and Credit Conditions
- Policy Rate: The Monetary Policy Committee (MPC) maintained the policy repo rate at 6.5% in FY24.
- Focus: Withdrawal of accommodation to align inflation with targets while supporting growth.
- Rate Hikes: Cumulative policy repo rate hike of 250 basis points from May 2022 to February 2023.
- Stance: The MPC has kept the policy repo rate unchanged since February 2023, ready to take appropriate actions if needed.
Liquidity Conditions and Trends in Policy Rates
- Liquidity Management: Two-way operations through Variable Rate Reverse Repo (VRRR) and Variable Rate Repo (VRR) auctions.
- The RBI conducted 17 fortnightly VRRR auctions and seven Variable Rate Repo (VRR) auctions as its main liquidity management operations. VRRR auctions are used to absorb excess liquidity from the banking system by allowing banks to park their surplus funds with the RBI at variable rates, which helps in controlling inflation and stabilizing financial markets.
- RBI allowed the reversal of liquidity facilities under both the SDF and the MSF.
- Influences on Monetary Conditions:
- Withdrawal of ₹2,000 banknotes and temporary imposition of incremental CRR (I-CRR) of 10% on August 2023. The total value of ₹2,000 banknotes in circulation has declined from ₹3.56 lakh crore as of 19 May 2023 to nearly nil as of June 2024. This move impounded approximately ₹1.1 lakh crore from the banking system to control liquidity.
- The merger of HDFC a non-bank with HDFC Bank (July 2023).
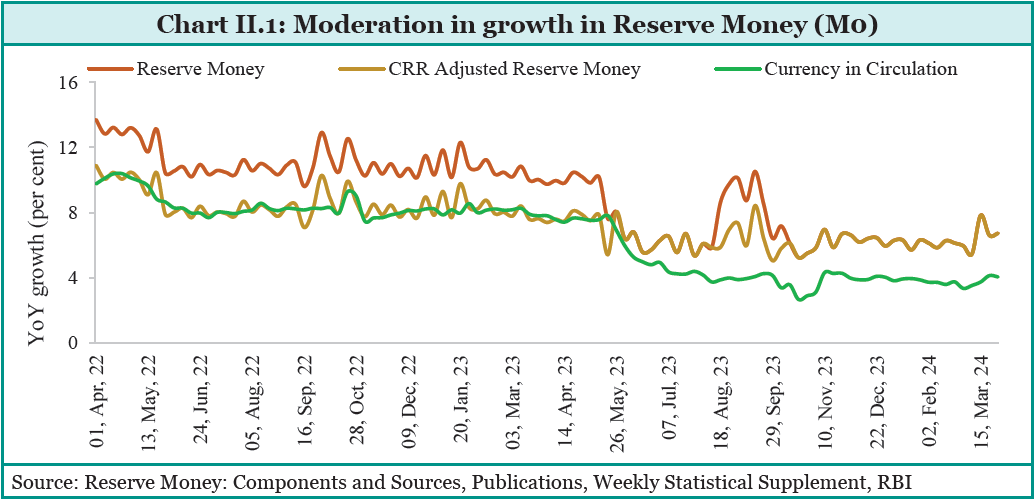
- Reserve Money (M0): Year-on-year growth of 6.7%, driven by net foreign assets.
- Deposits and Broad Money: A Steady Increase in term deposit rates accelerated aggregate deposits and broad money (M3) growth.
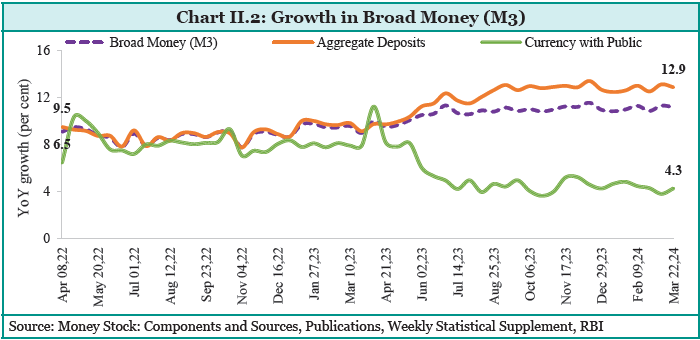
Money Multipliers Indicate higher liquidity in the market.
Monetary Policy Transmission
Lending and Deposit Rates have Increased among scheduled commercial banks (SCBs).
- Benchmark Lending Rates:
- External benchmark-based lending rate rose by 250 basis points.
- One-year median marginal-cost-of-funds-based lending rate increased by 175 basis points.
- Weighted Average Lending Rate (WALR):
- Outstanding rupee loans increased by 1.14 percentage points.
- Fresh rupee loans increased by 1.88 percentage points.
- Weighted Average Domestic Term Deposit Rate (WADTDR):
- Outstanding rupee deposits rose by 1.90 percentage points.
- Fresh rupee deposits increased by 2.44 percentage points.
FINANCIAL INTERMEDIATION
- What are Financial Intermediaries? These are institutes that facilitate financial resource allocation of any kind, such as commercial banks, payment banks, mutual funds etc. Financial intermediaries mobilise savings, extend credit, manage risk, and foster transactions for technological innovation and economic development.
- Efficient financial markets enhance economic growth by improving savings allocation and access to finance for all, including vulnerable groups and small firms.
- Ensuring financial stability requires sound financial development parameters like CRAR, liquid assets to deposits, and short-term credit. Robust regulation, supervision, and coordination among regulators are crucial for maintaining financial sector stability.
Performance of the banking sector and credit availability
- Deposit Growth: Deposit growth has gained momentum due to the repricing of deposits and higher accretion to term deposits following previous rate increases.
- Bank Credit Growth: Driven mainly by lending to services and personal loans, credit disbursal by Scheduled Commercial Banks (SCBs) stood at ₹164.3 lakh crore, growing by 20.2% by March 2024. This trend continues in FY25 with 19% and 19.8% year-on-year (YoY) growth in April and May 2024.
- NBFC Lending: Lending by non-banking financial companies (NBFCs) has accelerated, particularly in personal loans and loans to the industry, with improved asset quality.
Sectoral credit growth
Personal loans and NBFCs hold the largest share of bank credit.
- For agriculture and allied activities, credit rose from ₹13.3 lakh crore in FY21 to ₹20.7 lakh crore in FY24. The Kisan Credit Card (KCC) scheme has facilitated timely credit to farmers, with over 7.4 crore KCC accounts by the end of 2023.
- Industrial Credit Growth: Industrial credit growth picked up, registering single-digit growth, driven by increased bank credit to small and large industries. The Emergency Credit Linked Guarantee Scheme (ECLGS) has boosted credit disbursal to MSMEs through collateral-free loans with a 100% credit guarantee.
- Digital Lending Infrastructure: The availability of enriched and timely credit data and rapid implementation of digital lending infrastructure have significantly enhanced lender confidence.
- Future Technologies: The development of new technologies, such as the Open Credit Enablement Network (OCEN), is expected to further boost credit flow to the MSME sector.
- Service Sector: Bank credit to the services sector remained strong despite slower credit growth to NBFCs.
- Housing Loan: Housing loan disbursal significantly rose from ₹19.9 lakh crore in March 2023 to ₹27.2 lakh crore in March 2024.
- Credit to ‘commercial real estate’ and ‘trade’ sub-sectors improved in H2 FY24.
- Personal Loans: Digitalisation and increased use of credit bureaus (for faster decisions, data collation and validation and e-commerce transactions) boosted personal loan growth. However, this growth has moderated post-December 2023 due to higher capital requirements for unsecured personal loans and NBFC lending.
| Enhancing the Flow of Bank Credit to MSMEs Through Formalisation |
|
1. Introduction of Trade Receivables Discounting System (TReDS) Platform Function:
2. Change in Definition of MSMEs New Criteria:
3. Registration of MSMEs on Udyam Portal Portal Launch:
4. Revamp of Credit Guarantee Scheme (CGS) for MSEs Budget Announcement:
5. Implementation of Digital Lending Infrastructure Initiatives:
|
Improvement in asset quality of banks
The asset quality of banks has improved due to:
- Improved borrower selection,
- Effective debt recovery and
- Heightened debt awareness among large borrowers.
- Regulatory capital and liquidity requirements: qualitative metrics such as enhanced disclosures, robust code of conduct, and transparent governance structures have also improved banking performance.
Asset Quality:
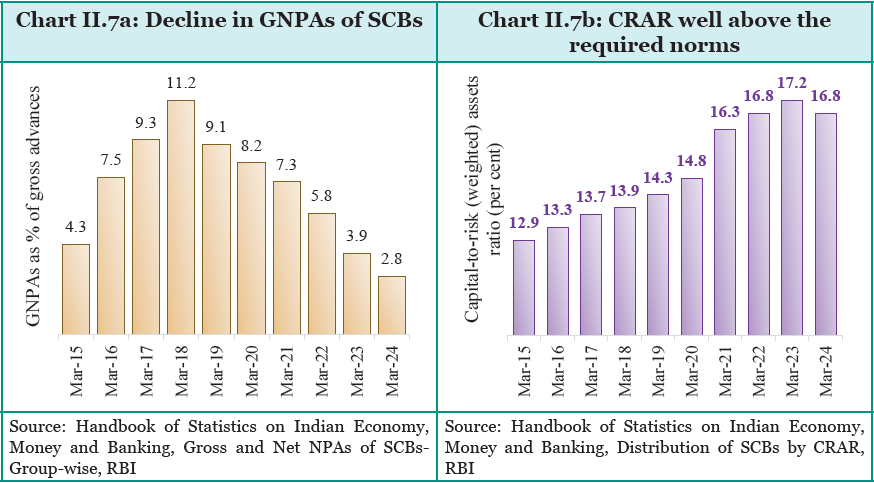
There have been Lower slippages and a reduction in outstanding GNPAs through recoveries, upgradations and write-offs led to this decrease. Lower GNPAs and high provisions accumulated in recent years contributed to a decline in net NPAs.
- The gross non-performing assets (GNPA) ratio of SCBs reached a 12-year low of 2.8% in March 2024 from 11.2% in FY18.
- GNPA of the agriculture sector: Remains high at 6.5%. The GNPA ratio in the personal loans segment improved across all categories.
- Industrial sector: improvement across all significant sub-sectors, barring vehicles and transport equipment.
Key Metrics:
| Situation in Scheduled Commercial Banks (SCBs) by March 2024 | Regulatory requirement |
| CRAR rose to 16.8%. | 9% of CAR + 2.5% of Capital Conservation buffer |
| All banks met the CET-1 ratio requirement averaged at 13.9%. | CET-1 ratio requirement = 5.5% for all financial institutions |
| Net interest margin (NIM) was robust at 3.6% in March 2024. | No specific requirement. Higher is healthier. |
| Profit after tax rose by 32.5% YoY in March 2024, despite higher operating expenses. | No specific requirement. |
| Profitability indicators, RoE and RoA, reached decadal highs in March 2024. | No specific requirement. |
| Cost of funds increased by 100 basis points, while the yield on assets rose by 75 basis points. | No specific requirement. |
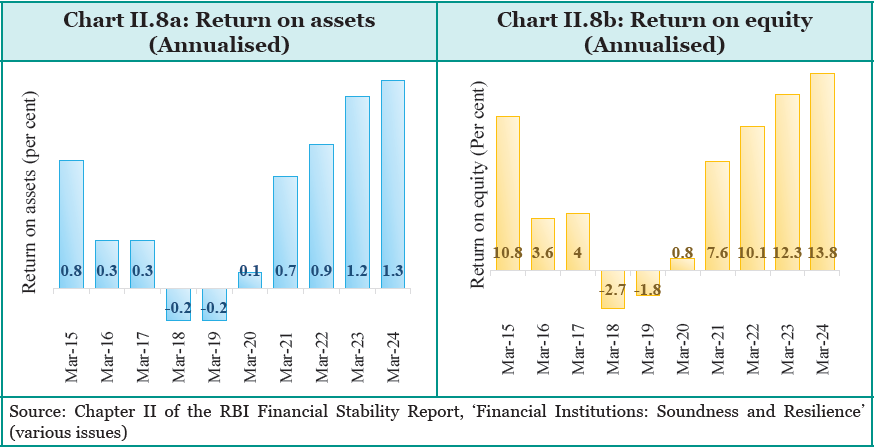
RBI’s report noted a high NIM negatively correlates with financial stability above a 5% threshold. NIM peaked at 3.9% in Q1 FY24 and moderated to 3.6% by March 2024.
Data from RBI’s Statistical Return Report
- PSBs hold the majority of Deposits: In March 2024, 56.9% of India’s deposits were with Public Sector Banks (PSBs). 61.1% of total deposits are owned by households considered sticky retail customers;
- Assets of Large banks: For the Top 10 Indian banks (in asset size), loans constitute more than 50% of their total assets, making banks immune to the rising interest rate cycle.
- Improvement in Indicators: After a phase of recapitalisation and cleaning up of bank balance sheets in the past years, there is a visible improvement in various banking indicators.
- Interest rate cycles have been quite prominent in India, aligning with RBI’s financial conditions and goal to maintain economic stability and manage inflationary pressures. The exposure to regular interest rate cycles has made Indian banks well-equipped to handle the cycles.
The trend of improvement in the profitability of SCBs, which began in FY20, continued for the fifth consecutive year in FY24. This has been aided by higher income and lower provisions and contingencies.
Dealing with distressed assets
Twin-Balance Sheet Crisis: Last decade saw Indian commercial banks face a crisis due to the significant burden of NPA. In March 2016, the GNPA of the PSBs was 14.5%. Whereas, the increased bank debt fuelled an increase in corporate leverage, especially in the industry and infrastructure sectors.
The Government took several measures such as:
- strengthening the banking regulatory framework,
- amending the recovery laws,
- enacting comprehensive insolvency and bankruptcy legislation, and
- establishing a public sector asset reconstruction company was implemented.
These measures have nursed the credit sector back to sound health, and the GNPA ratio shrunk to 2.8% in March 2024.
Reality Now: The Economic survey admits that there is an emergence of stress in the market due to the operation of market forces and the subsequent business/venture failures. But this is taken as a sign of an active and dynamic economy.
First Line of Defence for Financial Stability:
- Banks need to be equipped to deal with the flow of distressed assets, and the markets need to be equipped to channel investments into the reconstruction and revival of such assets.
- Banking regulations provide for monitoring, timely identification of stressed assets, and restructuring and rescheduling of loans.
- RBI has taken several measures to strengthen its prudential framework. The broad contours of these options form a part of banks’ risk management tool kit.
Conventional channels of recovery and reconstruction
In FY23, 45% of the reduction in GNPAs of Scheduled Commercial Banks (SCBs) was due to recoveries and upgrades. Debt Recovery Tribunals (DRTs) and the SARFAESI Act form the second line of measures to address stress.
Asset Reconstruction Companies (ARCs):
ARCs are regulated under the SARFAESI Act, to access NPAs. They issue security receipts (SRs) and are mandated to retain a minimum portion of SRs. In FY23, 28 ARCs operated, with 9.7% of SCBs’ GNPAs sold to ARCs, up from 3.2% in FY22.
Their importance:
- These are an alternative channel for investors,
- Efficient NPA markets must be deep, competitive, and liquid, ensuring adequate investor participation and efficient price discovery.
Government Interventions/Measures:
The government is strengthening the market through measures like establishing a bad bank and enhancing the insolvency and bankruptcy ecosystem.
- SEBI has improved liquidity for distressed assets, allowing FPIs to invest in debt instruments and SRs without minimum limits. FPI investment in SRs increased from ₹10,000 crore to ₹14,482 crore in FY22-23.
- The Special Situation Fund, a sub-component of Alternative Investment Funds, was introduced to invest in distressed assets and act as resolution applicants under the IBC.
- Bad Bank – Establishment of NARCL and IDRCL: In July 2021, the Government set up the National Asset Reconstruction Company Ltd. (NARCL) and India Debt Resolution Company Ltd. (IDRCL) to deepen the distressed asset market. NARCL acquires assets from banks, with government guarantees on the SRs issued. IDRCL has an exclusive arrangement with NARCL to resolve these assets, identifying appropriate resolution strategies for optimal outcomes.
Impact on Bank Balance Sheets: NARCL has acquired 18 accounts with a loan exposure of around ₹92,000 crore, including Srei Infrastructure Finance Ltd and Srei Equipment Finance Ltd. Offers on assets worth ₹1.25 lakh crore are in various acquisition stages, with due diligence and evaluations ongoing for assets worth ₹40,000 crore.
- Assets acquired by NARCL clear bank balance sheets, freeing capital for further lending.
- It will improve liquidity and competition in the distressed asset market.Insolvency and Bankruptcy Code: IBC has provided an avenue for corporate debtors to resolve their debt and get an honourable exit from failed businesses, thus promoting ease of doing business and encouraging entrepreneurship. In the eight years since 2016, 31,394 corporate debtors involving a value of ₹13.9 lakh crore have been disposed of. It has the following advantages:
4. Insolvency and Bankruptcy Code: IBC has provided an avenue for corporate debtors to resolve their debt and get an honourable exit from failed businesses, thus promoting ease of doing business and encouraging entrepreneurship. In the eight years since 2016, 31,394 corporate debtors involving a value of ₹13.9 lakh crore have been disposed of. It has the following advantages:
- It is an effective solution for addressing banks’ stress by aiding in significantly reducing GNPAs and helping rescue failing corporate debtors.
- Pre-admission Resolution: ₹10.2 lakh crore of defaults addressed at the pre-admission stage. Debtors tend to settle with creditors quickly once applications are filed with NCLT.
- Optimal Incentive-Disincentive Mix: Encourages transparent and above-board dealings between creditors and debtors.
- Value recovery: 947 cases resolved through approved resolution plans, realised ₹3.36 lakh crore, where Creditors recovered approximately 32% of claims, equating to 85% of fair value and 162% of liquidation value.
- Corporate Debtors: IBC processRescued 3,171 corporate debtors.
- Better Resource Productivity: Over 3,000 businesses continued operations post-corporate Insolvency Resolution Processes (CIRPs), enhancing resource productivity.
- Employment generation: The entities that are saved after the debt resolution can generate employment.
- Saving Business ecosystem: The IBC process has had a significant impact on the revival of the steel sector in India, which was ruined by cheap steel dumping by China in 2015. Defending India’s production capacity in the long run.
- Resource Recovery: IBC frees the resources of bankrupt businesses for alternate uses.
Due to its advantages, IBC is the main recovery route for Scheduled Commercial Banks (SCBs). Accounted for 43% of the total amount recovered by SCBs in FY23. Enabled over ₹3 lakh crore recovery for SCBs since FY18, surpassing Lok Adalats, DRTs, and SARFAESI Act recoveries.
Indian Institute of Management, Ahmedabad study reveals that those corporates that continued operations even after post-Corporate Insolvency Resolution Processes (CIRPs) performed well:
- Tangible assets and average capex have increased.
- Aggregate market valuation rose from ₹2 lakh crore to ₹6 lakh crore post-resolution.
- Total employment and average employee expenses increased by around 50% in three years post-resolution.
Resolution of Large Accounts:
- Nine out of twelve large accounts referred by RBI have been resolved, yielding 54% of admitted claims.
- Steel sector: These included major steel and power companies like Electrosteel Steels Ltd., Bhushan Steel Ltd., Monnet Ispat & Energy Ltd., Essar Steel India Ltd., and Bhushan Power & Steel Ltd. It has significant impact on the revival of the steel sector.
- Framework for Financial Service Providers in the Real Estate Sector: Covers NBFCs and Housing Finance Companies with assets of ₹500 crore or more. It enabled the resolution of Dewan Housing Finance Corporation Ltd., Srei Equipment Finance Limited, and Srei Infrastructure Finance Limited. Creditors recovered around 42% of claims in these cases.
| Stepwise Process and Developments in Addressing Stalled Housing Projects |
|
Pre-2016 Scenario:
Enactment of Real Estate (Regulation and Development) Act 2016 (RERA) (2016):
Introduction of Insolvency and Bankruptcy Code (IBC) (2016): It opened another channel for resolution. Over 1500 real estate companies were admitted into the insolvency resolution process by March 2024, accounting for 21% of total admissions.
Recognition and Amendments: significant changes in the CIRP.
Integration with RERA:
Successful Resolutions: Real estate companies successfully resolved stalled projects.
Government Intervention – SWAMIH Fund (2019):
Impact of these reforms:
|
Financial Inclusion is Within Reach; Digital Financial Inclusion is the Next Goal
- Importance of Financial Inclusion:
- It is a key enabler for sustainable economic growth.
- It reduces inequality and eliminates poverty.
- Recognized by the UN as crucial for achieving 2030 SDGs.
- Government Prioritization:
- Focus on delivering financial services to all, especially the underserved.
- Overcame significant challenges since 2008 with low financial inclusion and formal identification.
- Progress in India:
- A remarkable increase in adults with formal financial accounts from 35% in 2011 to 77% in 2021 (World Bank data). [Shown in the table below]
- Increased percentage of adults saving and borrowing from formal sources.
- Reduced access gap between rich and poor.
- Narrowed gender divide in financial inclusion.
- Youth also benefit from financial inclusion efforts.
- Comparison with Averages:
- India outperforms South Asian and global averages in specific financial inclusion indicators.
- Impact of Focused Efforts:
- Estimated 47 years to achieve 80% bank account coverage relying solely on traditional growth.
- Highlights the necessity and potential of digital financial inclusion as the next objective.
| Country | Adults with an Account at a Formal Financial Institution (% age 15+) | Adults Saving at a Financial Institution (% age 25+) | Borrowed from Formal Financial Institution, Older (% age 25+) |
| World | 76 | 29 | 32 |
| South Asia | 68 | 11 | 12 |
| Brazil | 84 | 23 | 42 |
| China | 89 | 45 | 42 |
| India | 78 | 13 | 13 |
| Indonesia | 52 | 20 | 15 |
| South Africa | 85 | 37 | 20 |
- Shift in Focus:
- Create an inclusive ecosystem for larger population segments.: From ‘every household’ to ‘every adult’.
- Emphasis on account usage through enhanced Direct Benefit Transfer (DBT) flows.
- Promotion of digital payments using RuPay cards, UPI, etc.
- Enhance national and cross-border payment systems efficiency.
- Innovations in Digital Payments:
- UPI123Pay: Launched in 2022 for UPI payments via feature phones.
- UPI Lite: On-device wallet service for low-value transactions up to ₹200 through the BHIM app.
International Collaborations:
RBI’s bilateral efforts to link India’s UPI with other countries’ Fast payment systems (FPS) for cross-border P2P (Person to Person) and P2M (Person to Merchant) payments.
- Participation in Project Nexus, aiming to interlink Fast payment systems (FPSs) of ASEAN countries (Malaysia, Philippines, Singapore, Thailand) and India.
- The agreement was signed by BIS and central banks on 30 June 2024.
- Platform expected to go live by 2026, enhancing efficiency, speed, and cost-effectiveness of cross-border retail payments.
- What is a Fast Payment system? It is an electronic payment system that facilitates inter-bank fund transfers and sends confirmation of payment to the receiver and originator within a minute or less.
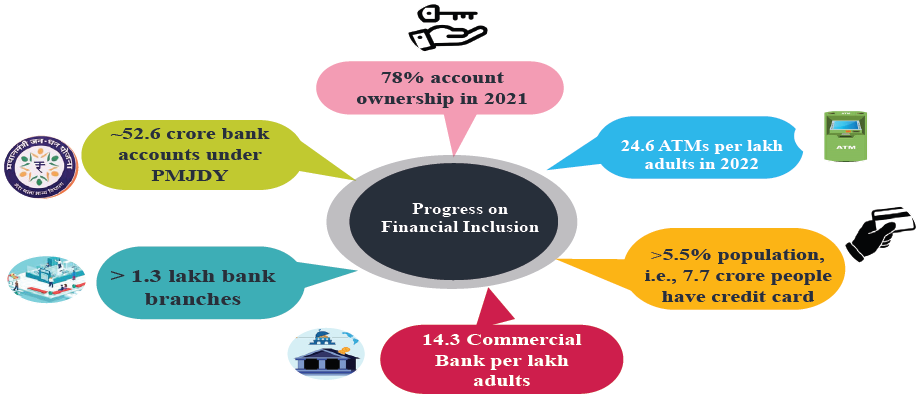
Digital Financial Inclusion
Digital Financial Inclusion (DFI) aims to provide cost-effective digital access to formal financial services for excluded and underserved citizens. Essential DFI components include digital transactional platforms and devices for transactions.
- Digitalization as a Key Enabler: Digitalization has transformed the global financial services landscape. Ensuring Digital Financial Inclusion (DFI) is the next major challenge.
- The positive impact of the Pandemic: COVID-19accelerated the digitization of financial services in India. The government promoted innovation and developed a technology-led digital infrastructure. This has led to an inclusive, cost-efficient, and responsible Digital Public Infrastructure (DPI).
Government Initiatives for Digital Financial Inclusion (DFI):
- Flagship schemes like Digital India Mission and Make-in-India were launched.
- Creation of Digital Public Infrastructure (DPI): components such as Aadhaar, e-KYC, UPI, Bharat QR, DigiLocker, e-sign, Account Aggregator, and Open Network for Digital Commerce. These DPIs enhance transparency, scalability, and timely delivery of financial services.
- DPI-enabled digital transformation: The fintech industry’s growth is supported by a growing population, world-class DPI, and proactive regulations. India is among the fastest-growing fintech markets globally, being the third-largest fintech economy.
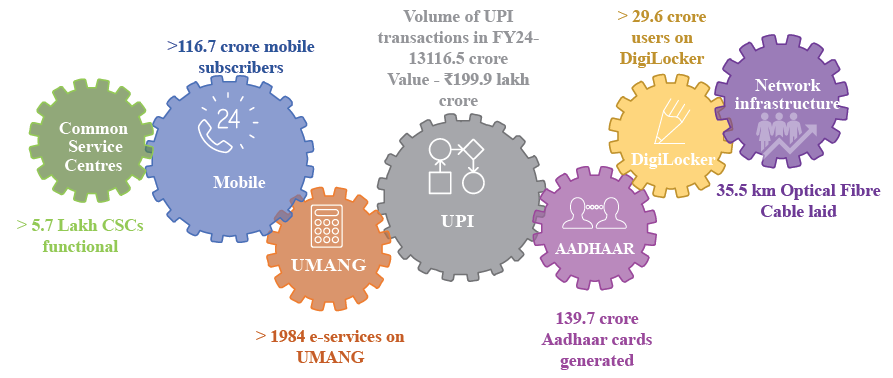
Advances in Digital Financial Inclusion (DFI):
- Enabled millions in both formal and informal economies to accept payments, settle invoices, and transfer funds with ease.
- Built on the India Stack, which includes digital identity, payment, and data-management systems.
India Stack Components:
India Stack has three components:
- Identity Layer:
- Aadhaar has revolutionized India’s authentication ecosystem.
- Facilitated e-KYC, reducing costs from USD 12 to 6 cents.
- Extended banking services to millions, enhancing financial inclusion.
- Payment Layer:
- Unified Payments Interface (UPI) has transformed the payment system.
- Smartphone usage expansion has supported UPI’s success.
- UPI transaction values increased from ₹0.07 lakh crore in FY17 to ₹200 lakh crore in FY24.
- Data Governance Layer:
- Ensures user ownership and control over their data.
Impact on Economic Growth:
- Digital credit empowers individuals and firms, fostering economic opportunities.
- IMF research indicates a 2.2% rise in average economic growth with increased digital financial inclusion, driven by higher consumption and formalization.
Microfinance institutions: facilitating financial inclusion
Microfinance provides financial services, including small loans, to households, small businesses, and entrepreneurs without access to formal banking.
- It promotes financial inclusion, social equity, and empowerment for the poor and marginalized.
- It offers affordable doorstep services and additional financial services like insurance, remittance, and financial literacy.
Evolution of Micro-finance in India:
- Steps taken by RBI:
- Supported by RBI’s regulatory framework and Industry Code of Conduct by SROs like Sa-Dhan and MFIN (Microfinance Industry Network).
- RBI’s New Regulatory Framework (March 2022) ensures uniform regulations for all microfinance entities, creating a level playing field and protecting borrowers.
- Global and National Impact: India has the world’s second-largest microfinance sector globally after China.
- Microfinance covers over 50% of households and 10% of India’s population.
- 213 MFIs operate in 28 states, 5 UTs, and 646+ districts, with a network of 25,790 branches and 2.2 lakh employees.
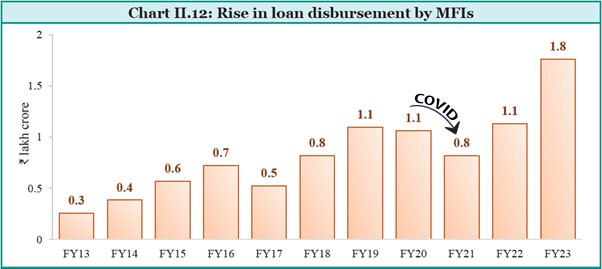
- Active clients (excluding those overdue over 179 days) stood at 532 lakhs, with a 19% YoY growth with ₹1.8 lakh crore in loans as of FY23.
- Rural and Urban Focus: Initially served both rural and urban poor, but now primarily oriented towards rural areas. The current rural clientele share is 74%, reflecting a sustained shift towards rural sectors over the past four years.
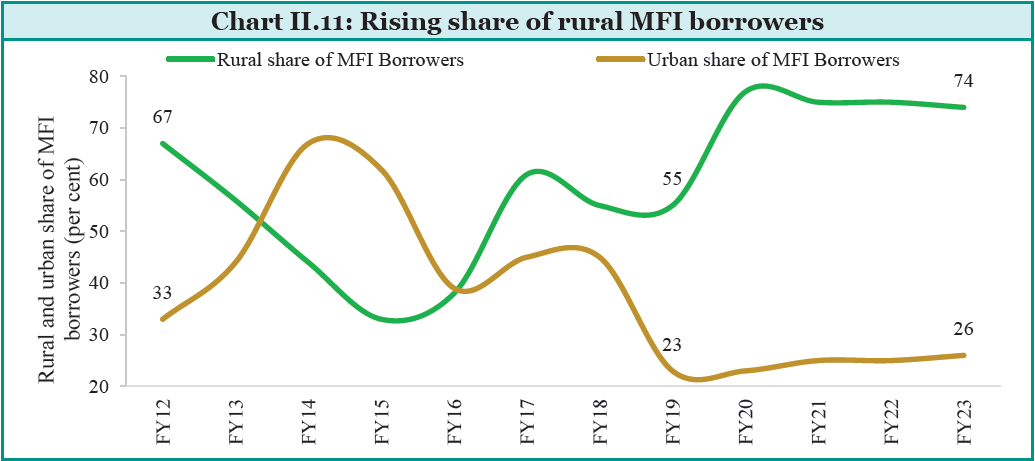
- Microfinance is mostly a woman-focused activity. Women constitute 98% of the total clients of MFIs. Further, it also serves other weaker and marginalised sections. The SC/ST borrowers constitute a substantial 23% of the clients.
- Microfinance Loan Disbursement: Steady growth in loan disbursement by MFIs, except during external events like COVID-19. In FY23, the sector bounced back with an aggregate disbursement of ₹1.8 lakh crore, a 55% increase from the previous year.
- The RBI’s Financial Inclusion Index improved from 60.1 in March 2023 to 64.2 in March 2024, indicating progress in financial sector access, usage, and quality.
Financial Health and Profitability of MFIs
- Total assets reached ₹1.5 lakh crore, a 30% increase from the previous year.
- Profitability ratios improved: Return on Assets (RoA) was 2.5%, and Return on Equity (RoE) was 12.2%.
- Operating costs were trimmed while finance costs remained stable.
- Median Capital Adequacy Ratio (CAR) for MFIs was 26.5%, well above the RBI’s required 15%.
- Portfolio Quality and Recovery: Significant progress in improving portfolio quality, reducing defaults, and enhancing recoveries.
Success in Rural India:
The SHG-Bank Linkage Programme (SHG-BLP) showed strong post-pandemic recovery.
- Credit disbursement under SHG-BLP was ₹1.5 lakh crore in FY23, a 45.6% increase.
- SHG savings held by banks reached ₹58,893 crore, with a 24.7% growth.
- The number of credit-linked SHGs rose to 43 lakhs in FY23 from 34 lakhs in FY22.
Trends in Indian capital markets
Despite heightened geopolitical risks, rising interest rates, and volatile commodity prices, Indian capital markets have outperformed many emerging markets in FY24, reflecting the country’s strong economic standing.
Primary Markets
- Capital Formation: The capital formation in the Primary markets reached ₹10.9 lakh crore, a 17.2% increase from ₹9.3 lakh crore in FY23. Of this, 78.8% was through debt issuances.
- Initial Public Offers (IPOs): The number of IPOs was 272, a 66% jump from the previous year. The amount raised through IPOs increased by 24% to ₹67,995 crore in FY24.
- IPOs by SMEs: In fact, SME platforms saw 196 IPOs/FPOs in FY24 compared to 125 in FY23, raising ₹6,095 crore, more than double the previous year’s amount.
- Qualified Institutional Placements (QIPs) emerged as a significant equity fundraising mechanism.
- Right Issues: Resource mobilization through rights issues more than doubled to ₹15,110 crore in FY24, up from ₹6,751 crore in the previous year.
| What is the Primary Market? |
|
It is the part of the Capital market that deals with the sale of securities by its issuer directly to the purchaser. Such fundraising can be done via equity, debt, and other hybrid modes.
|
Public Debt Issuances
- Corporate Debt Market: The value of corporate bond issuances increased to ₹8.6 lakh crore in FY24, up from ₹7.6 lakh crore in the previous year.
- The number of corporate bonds public issues reached a four-year high, raising ₹19,167 crore.
- Private placements remained the dominant channel, accounting for 97.8% of total resources mobilized.
- The outstanding corporate bonds’ value grew by 5.5% YoY to ₹45 lakh crore (15.5% of GDP) by March 2024.
REITs and InvITs:
- Real Estate Investment Trusts (REITs) and Infrastructure Investment Trusts (InvITs) raised ₹39,024 crore in FY24, more than five times the amount raised in FY23.
Secondary Markets
| What is the Secondary market? It is the part of the Capital Market where investors directly buy or sell securities from other investors. |
- Indian Market Performance: Indian stock markets performed exceptionally well in FY24, with the Nifty 50 index increasing by 26.8%, compared to a decrease of 8.2% in FY23.
- Global markets, including the US, Brazil, and Japan, also showed strong performance, driven by an AI-led tech stock surge.
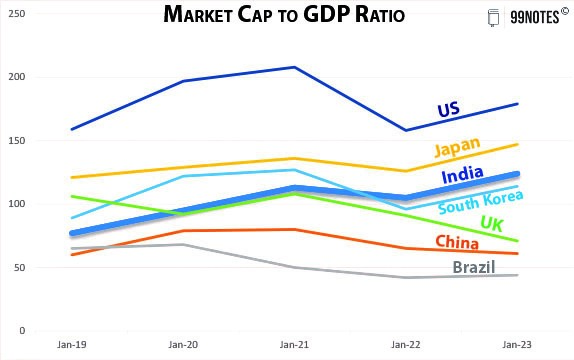
- Market Capitalization: India’s market capitalization saw significant growth, making it the fifth largest globally. The market capitalization to GDP ratio increased to 124% in FY24 from 77% in FY19, indicating strong investor interest.
| Year | India | China | Brazil | Japan | South Korea | United Kingdom | United States |
| Dec-19 | 77 | 60 | 65 | 121 | 89 | 106 | 159 |
| Dec-20 | 95 | 79 | 68 | 129 | 122 | 92 | 197 |
| Dec-21 | 113 | 80 | 50 | 136 | 127 | 108 | 208 |
| Dec-22 | 105 | 65 | 42 | 126 | 96 | 91 | 158 |
| Dec-23 | 124 | 61 | 44 | 147 | 114 | 71 | 179 |
- Trading Volume: Value traded increased across all segments except currency derivatives. Commodity derivatives turnover rose by 87% in FY24, driven by the energy segment.
- Institutional Investment: India’s weight in the MSCI-EM index rose to 17.7% at the end of FY24, up from 13.7% in April 2023, marking the second-highest share among emerging markets in the index.
| The Synergy of Technology and Indian Capital Markets: Driving Growth and Efficiency |
|
Indian capital markets have expanded significantly, with equity market capitalization reaching ₹415 lakh crore (USD 5 trillion) in May 2024, ranking fifth globally. Technology has played a pivotal in this transformation, enhancing growth and efficiency. It aids in achieving SEBI’s goals: market regulation, investor protection, and market development.
Technological Developments:
Challenges and Regulatory Efforts:
|
Retail Participation in the Capital Market
- The surge in Retail Activity: due to a surge in direct trading and mutual funds, Individual investors accounted for 35.9% of the turnover in FY24. The number of demat accounts rose from 11.45 Cr in FY23 to 15.14 Cr in FY24.
- Investor Base: Registered investors at NSE tripled from March 2020 to March 2024, reaching 9.2 crore, representing about 20% of Indian households.
Mutual Funds:
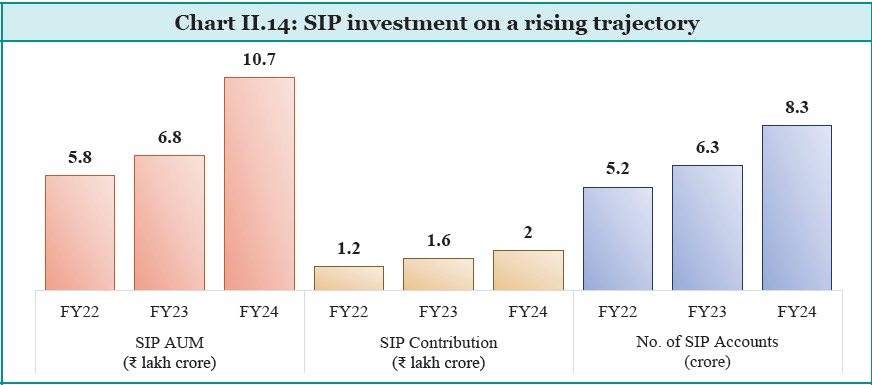
- Growth in AuM: Mutual funds saw a 35% YoY growth, with Asset under Management (AuM) reaching ₹53.4 lakh crore at the end of FY24.
- Increase in Folios: Folios increased from 14.6 crore in FY23 to 17.8 crore in FY24.
| Key terms used here |
|
- Net Inflows: Growth/equity-oriented and hybrid schemes accounted for over 90% of net inflows.
- SIP Accounts: Approximately 8.4 crore SIP accounts contributed to a doubling of annual net SIP flows from ₹0.96 lakh crore in FY21 to ₹2 lakh crore in FY24.
- MF Ownership: MFs owned 9.2% of Indian equities as of December 2023, up from 7.7% in December 2021.
Factors Facilitating Retail Entry:
- Technological Integration: Seamless integration and digital infrastructure growth.
- Government Measures: Financial inclusion initiatives and rapid smartphone penetration.
- Low-Cost Brokerages: Rise of affordable brokerage services.
- Economic Environment: Post-COVID-19 recovery, lower interest rates, elevated inflation, and supportive policies.
- Investor Awareness: Continuous education programs and SEBI initiatives like Online Dispute Resolution and centralised reporting for investor demise.
Advantage of Retail Investors:
- Unique Tax IDs: Tax IDs registered on NSE rose from 2.7 crore in FY19 to 9.2 crore in FY24.
- Stability and Higher Returns: Enhanced retail participation lends stability and enables higher returns on savings.
Risks involved
- Derivative trading: Many new retail investors are young with a higher risk appetite, showing interest in derivatives trading. Despite potential gains, derivatives trading often results in losses.
- Financial market innovations outpacing economic growth have led to various economic crises in history, such as the 2008 global financial crisis and the 1997-98 Asian crisis.
Way Forward:
- Orderly Evolution: India needs a gradual evolution of its financial market to prevent similar setbacks.
- Role of Stakeholders: Raising awareness and financial education is crucial to warn investors about these risks.
- National and Self-Interest: Market participants, infrastructure institutions, regulators, and the Government must ensure capital markets direct savings to productive investments, benefiting both the nation and individual stakeholders.
In the Union Budget of 2024-25, the Securities transaction tax has been increased by 5 times to 0.1% to discourage speculation in the market.
| Social Stock Exchanges in India: Making Progress |
|
Indian securities markets have expanded significantly. To leverage these strengths for social good, the Government proposed the creation of a Social Stock Exchange (SSE) under SEBI in the Union Budget of FY20. The SSE aims to list social enterprises and voluntary organizations to raise capital for social welfare objectives. Need for Social Stock Exchange
Operationalisation of SSEs
Progress So Far
|
GIFT IFSC: Emerging as a Dominant Gateway for Global Capital Inflows into India
The International Financial Services Centre (IFSC) in GIFT City, Gujarat, is designed to serve as an international financial hub within India, aiming to attract global financial services and channel capital flows into and out of the country. GIFT IFSC exemplifies India’s commitment to position itself as a global leader in international finance in the following ways:
- IFSC is a Non-Resident Zone designated under the Foreign Exchange Management Act, i.e. it allows entities to operate in eleven foreign currencies without capital control restrictions.
- Unified Regulator: Overseen by the International Financial Services Centres Authority (IFSCA) which is a statutory body (formed by the Parliament), simplifying the regulatory process for global investors and institutions.
- Competitive Tax Regime: Offers tax benefits on par with leading global financial centres, making it an attractive location for financial services.
Key Business Activities
- Banking Sector: GIFT IFSC’s banking ecosystem caters to the foreign currency borrowing needs of Indian corporates. By March 2024, the total asset size of IFSC Banking Units (IBUs) exceeded USD 60 billion, with cumulative transactions surpassing USD 795 billion.
- Funds Industry: Rapid growth in Fund Management Entities (FMEs) and Alternative Investment Funds (AIFs) has been observed. Registered FMEs increased from 39 to 114, and funds from 33 to 120 between September 2022 and March 2024. This shift has redirected the pooling of international capital for Indian investments from offshore jurisdictions to GIFT IFSC.
- Aircraft & Ship Leasing and Financing: With the aviation industry’s growth, GIFT IFSC has become a hub for aircraft leasing, attracting over 28 lessors who have leased more than 120 aviation assets. The ship leasing sector is also gaining traction, with 11 companies registered by March 2024.
- Foreign Universities Initiative: GIFT IFSC is set to become an international education hub. Deakin University and the University of Wollongong Australia have established campuses, paving the way for other global universities.
Reforms and Future Prospects
Ongoing reforms aim to establish GIFT IFSC as a reputed international financial centre. Notable initiatives include:
- Single Window IT System: Simplifies registration processes and avoids dual regulations.
- Insurance Sector: Initiatives to position India as a global reinsurance hub and reforms to improve insurance offerings and regulatory frameworks.
- Pension Sector: Addressing the inclusion of gig workers and the shift from defined benefit to defined contribution pension arrangements.
Developments in the Insurance Sector
Driven by economic growth, an expanding middle class, innovation, and regulatory support the Indian Insurance market has been growing. However, it has faced various challenges in the past two years.
Challenges for Global Insurance Markets
- The global economic slowdown and inflation have created challenges for insurers, such as rising capital costs and issues with reserve adequacy due to high inflation and the COVID-19 pandemic.
- Contraction in Premiums: In 2022, global insurance premiums contracted by 1.1% compared to 2021’s growth of 3.4%. Non-life insurance premiums grew by 0.5%, while life insurance premiums contracted by 3.1%.
Challenges in Indian Insurance Market
Moderated in FY23; overall insurance penetration decreased slightly to 4% from 4.2% in FY22. Government Schemes like Ayushman Bharat Pradhan Mantri Jan Arogya Yojana (AB-PMJAY) have expanded health insurance coverage.
- Life Insurance: Penetration declined to 3% from 3.2%, while non-life insurance remained at 1%. Insurance density rose slightly.
- Life Premium Growth: Estimated to slow to 4.1% in FY23 from 5.9% in FY22 due to fading pandemic risk awareness and changes in tax norms.
- Non-Life Insurance Segment: Moderated to an estimated 7.7% in FY23 from 9% in FY22. Health insurance premiums, which account for 35% of sector premiums, grew by 11%.
- Agriculture Insurance: Expected in FY23 due to a decline in premium rates, offset by increased insured land area and farmer enrolments. Future growth is expected at 2.5% annually.
Regulatory Support
- “Insurance for All by 2047”: Launched to ensure comprehensive insurance coverage.
- Reinsurance Regulations: Amendments aim to position India as a global reinsurance hub.
- Regulatory Review: Transition to a principle-based regulatory approach with a focus on risk management. Simplified reinsurance formats and aligned frameworks with IFSCA rules.
Future Projections
- Premium Growth: Total premiums in India are projected to grow by 7.1% in real terms from 2024-28, the fastest among G20 countries.
- Insurance Penetration: Expected to rise from 3.8% in FY23 to 4.3% by FY35.
- Life and Non-Life Growth: Life premiums are projected to grow by 6.7% annually, and non-life premiums by 8.3%.
Challenges
- Customer-Friendliness: Need to address issues such as mis-selling and claim disputes. The industry must adopt long-term strategies to improve customer satisfaction and trust.
- Regulatory Effectiveness: Principle-based regulations need to be carefully managed to prevent exploitation by the financial sector.
Developments in the Pension Sector
- Demographic Changes: Falling birth rates and inflation pose challenges to pension systems.
- Shift to Defined Contribution (DC): Global trend towards DC arrangements where individuals bear investment and inflation risks.
- Inclusion of Gig Workers: Pension systems must adapt to the changing labour market, focusing on individual contributions rather than employer-employee relationships.
Developments in the Pension Sector
The Pension sector is undergoing a significant shift:
- Falling Birth Rates: Many countries are experiencing significant demographic changes due to declining birth rates, impacting pay-as-you-go pension arrangements that depend on the next generation of taxpayers to fund pensions.
- Recent inflation spikes have eroded confidence in pension programs’ ability to provide adequate long-term retirement benefits, despite some economies seeing a decline in inflation rates.
- Shift from Defined Benefit to Defined Contribution: There is a global trend shifting from defined benefit (DB) plans to DC plans, where individuals bear all risks related to investment returns, inflation, and longevity.
Pension Plans must be adaptable:
Few pension systems have successfully transitioned from individual DC accumulation to post-retirement systems that offer both secure income and flexibility.
- The rise of gig workers and the informal labour market is fracturing traditional employer-employee relationships, necessitating more individually focused pension arrangements.
- Pension systems must adapt to become less reliant on third parties and more focused on individual contributions to accommodate the changing labour market dynamics.
Performance of India’s Pension Sector
The pension system includes an employee pension scheme, an Employee Provident Fund (EPF), and supplementary employer-managed DC schemes. Government schemes like the National Pension Scheme (NPS) and Atal Pension Yojana (APY) aim to benefit the unorganised sector.
- Improved Global Pension Index: India’s global pension index improved from 44.5 in 2022 to 45.9 in 2023, driven by better adequacy and sustainability sub-indices.
- Coverage and Participation: Formal retirement sources have become more prominent due to changes in workforce dynamics. While there’s improvement in the net pension replacement rate and private pension plan participation, coverage of the Indian workforce under private pension plans needs enhancement.
- Growth in Subscribers: Total pension subscribers grew to 735.6 lakh in March 2024, up 18% from last year. APY subscribers increased from 501.2 lakh to 588.4 lakh, accounting for about 80% of the total pension subscriber base.
Gender and Age Mix
- Female APY subscribers increased from 37.2% in FY17 to 48.5% in FY23.
- Younger subscribers (18-25 age group) rose from 35% in FY17 to 46.7% in FY23.
- Most APY accounts (92%) are for a pension amount of ₹1,000 per month, primarily targeting low-income households.
Pension Coverage and Assets
- Pension coverage under NPS and APY as a share of the total population increased from 1.2% in FY17 to 5.3% in FY24.
- Assets under management (AuM) for these schemes grew from 1.1% of GDP in FY17 to 4% in FY24.
- NPS is expected to expand rapidly among corporate employees, self-employed professionals, and better-off households.
- NPS has potential in rural areas for larger farmers and traders due to flexible contribution requirements.
- As India’s per capita income rises, pension coverage is expected to grow, especially with a young population and increasing life expectancy.
Encouraging Pension Participation
- Financial literacy is crucial for maximizing benefits from the formal financial sector. Women should have pension accounts due to higher longevity. Young adults and students should be encouraged to open pension accounts to develop long-term saving habits.
- Financial inclusion should ensure each family member has a pension account. Employers, intermediaries, the Government, and the pension regulator should nudge people, especially young adults, to join pension schemes.
- Early participation with small contributions can accumulate a significant corpus over time due to compounding, ensuring a steady income post-retirement.
Mechanisms to Ensure Regulatory Coordination and Overall Financial Stability
Financial stability is essential for sustainable economic growth. A stable financial system must withstand macroeconomic disturbances and manage imbalances before they become crises.
Governments employ various policies, regulations, and measures to ensure financial sector integrity. Coordination among financial regulators and those responsible for price and economic stability is crucial.
- Financial Sector Development Council (FSDC) is a forum for interaction among financial sector regulators in India, dealing with financial stability, sector development, inter-regulatory coordination, financial literacy, and inclusion.
- FSDC Sub-Committee (FSDC-SC): Chaired by the RBI Governor, it discusses agenda items proposed by members and supportive actions required.
- Reserve Bank of India (RBI) promotes financial sector resilience through regulation, monitoring systemic risks, and implementing monetary policy.It publishes the bi-annual Financial Stability Report (FSR) to assess risks and the strength of the financial system.
- Financial Sector Assessment Program (FSAP): Conducted every five years by the IMF and World Bank for countries with systemically important financial sectors. The third FSAP for India is underway for 2023-24, with reports expected by February 2025.
- Reports: Financial System Stability Assessment Report (FSSA) and Financial Sector Assessment (FSA) report.
- Basel III Reforms: India has largely complied with Basel III reforms, ensuring bank resilience through measures like the Net Stable Funding Ratio, liquidity coverage ratio, and supervisory frameworks for large exposures. India is also implementing revised leverage ratio requirements and risk-based capital frameworks.
- Compensation and OTC Derivatives: India follows Standards for Sound Compensation Practices for significant banks, insurers, and asset managers. Significant progress in OTC derivatives compliance, with more than 90% following trade reporting, central clearing, and platform trading requirements.
- Non-Banking Financial Intermediation (NBFI): India complies with FSB requirements for Money Market Mutual Funds, Securitisation, and Securities Financing Transactions. India is the only jurisdiction fully compliant with SFT requirements among the 24 reported by FSB.
- Financial System Stress Indicator (FSSI): Developed by the RBI to monitor stress levels in the financial system. It aims to identify stress periods, assess stress intensity and duration, and gauge financial markets’ ability to withstand shocks.
Latest FSR Findings (June 2024)
- Improvement: Gradual easing of stress during H2 of FY24, with broad-based declines except in NBFC and money market segments.
- Government Debt Market: Primary contributor to reduced stress, aided by falling long-term yields and higher net foreign portfolio debt inflows.
- Foreign Exchange Market: Lower stress due to reduced volatility and rangebound exchange rates.
- Money Market: Increased stress due to tight liquidity and higher interest rates on instruments.
- Banking System: Supported by improving soundness.
- Real Sector: Stress moderated due to strong macroeconomic fundamentals.
- NBFC Sector: Increased stress due to lower capital ratios and higher borrowing costs.


