Chapter 1: State of the Economy: Steady as She Goes
Global Economic Scenario
Current Problems Facing the Global Economy
- Buoyancy in Revenues Continues in FY24:
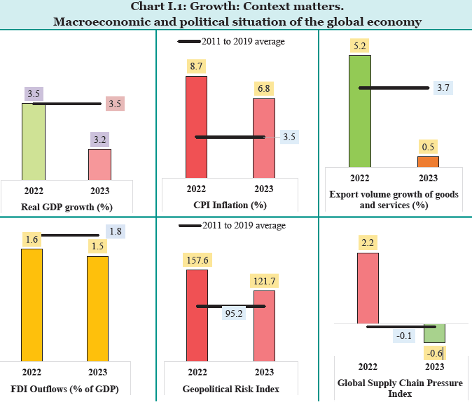
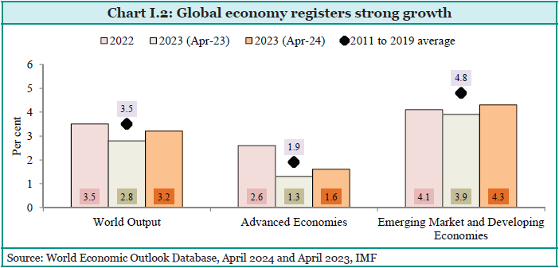
- Global GDP Growth: Despite geopolitical uncertainties and inflationary pressures, the global economy registered a growth of 3.2% in 2023, which is robust but marginally lower than in 2022.
- Inflation Trends: Inflationary pressures have been high due to supply chain disruptions and geopolitical tensions, particularly from the Russia-Ukraine conflict. While headline inflation has moderated, core inflation remains persistently high.
- Supply Chain Disruptions: The global supply chain pressure index has eased, but intermittent disruptions continue to pose challenges, especially due to geopolitical tensions in regions like the Middle East.
- Geopolitical Risks: Geopolitical risks have increased, with ongoing conflicts and tensions potentially disrupting global trade and economic stability.
- Economic Performance by Region:
- Advanced Economies: The US and other advanced economies experienced continued growth, although the Euro area faced subdued economic activity due to the impacts of geopolitical conflicts and monetary tightening.
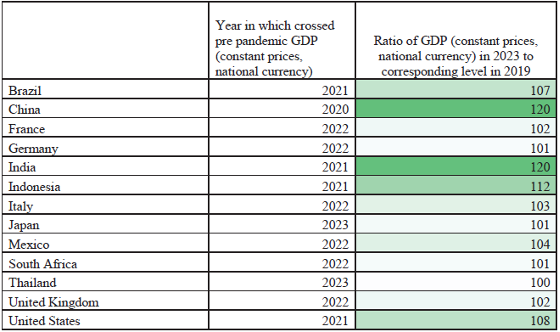
- Emerging Market Economies: Countries like India and China surpassed their pre-pandemic GDP levels, showcasing strong growth. However, growth across emerging markets has been uneven, with some regions struggling more than others.
Most economies have recovered after the Pandemic; India is the outshining element among all.
- Trade and Investment:
- Global Trade: The volume of global exports grew modestly by 0.5% in 2023, affected by lower demand in developed economies and weaker trade in East Asia and Latin America. Rising cross-border trade restrictions and geopolitical realignments further constrained trade growth.
- Foreign Direct Investment (FDI): Global FDI flows declined in 2023 compared to the previous year, reflecting investor caution amid high borrowing costs and economic uncertainties.
- Monetary Policy and Financial Conditions:
- Policy Rates: Many central banks maintained or raised policy rates to combat persistent inflation, with the US Federal Reserve indicating potential rate cuts in 2024. The European Central Bank (ECB) cut its policy rate for the first time in nearly five years, signalling a possible shift in monetary policy stance.
- Financial Conditions: Financial market conditions have eased somewhat, but the cost of borrowing remains high, influencing investment and economic activity. The yield curve inversion in the US indicates investor expectations of future rate cuts.
- Fiscal Policy:
- Fiscal Deficit and Public Debt: The global general government fiscal deficit increased by 1.6 percentage points in 2023 due to a decline in revenues and stable expenditures. Consequently, global public debt also inched up.
- Commodity Prices: High energy and commodity prices continued to affect the global economy, with inflationary pressures impacting consumer demand and trade volumes.
- Outlook and Challenges:
- The global economic outlook remains cautiously optimistic, with growth expected to continue if no major geopolitical shocks occur. However, the risks of geopolitical disturbances, high inflation, and economic fragmentation pose significant challenges to sustained global economic stability.
The global economy has shown resilience and growth despite significant challenges, including geopolitical tensions, inflation, and supply chain disruptions. Continued efforts to manage these issues and adapt to changing economic conditions will be crucial for maintaining stability and growth in the coming years.
A Resilient Domestic Economy
Overview of India’s Economic Resilience
Carrying Forward Momentum:
- Strong GDP Growth:
- India’s economy continued its momentum from FY23 into FY24, achieving a real GDP growth of 8.2%. This marked the third consecutive year of over 7% growth, driven by stable consumption and improving investment demand.
- Gross Value Added (GVA) at 2011-12 prices grew by 7.2%, with net taxes at constant prices growing by 19.1% due to strong tax growth and rationalization of subsidy expenditure.
Sectoral Performance:
- Agriculture Sector: Agriculture’s share in overall GVA was 17.7% in FY24. Despite erratic weather patterns and uneven monsoon distribution, the agriculture sector continued to grow, albeit at a slower pace. The total foodgrain output for FY24 saw a marginal decline of 0.3%.
- Industrial Sector:
-
- The industrial sector showed robust performance, with manufacturing GVA growing by 9.9%. Reduced input prices and stable domestic demand boosted manufacturing activities.
- Construction activities registered a growth of 9.9% due to infrastructure development and buoyant real estate demand.
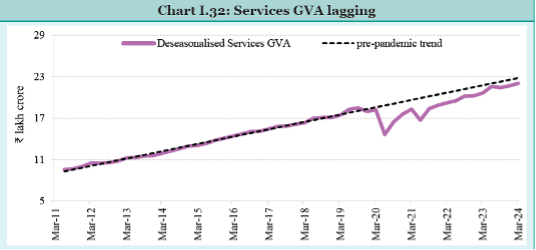
- Services Sector: The services sector continued to thrive, with high-frequency indicators like GST collections and e-way bill issuance reflecting strong performance. Contact-intensive services like trade, transport, and real estate emerged stronger post-pandemic, embedding greater technology and digital content.
- Service GVA is still Lagging:
Demand-Side Drivers:
- Private Consumption:
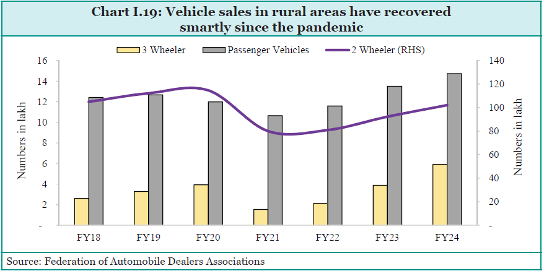
Private final consumption expenditure (PFCE) grew by 4.0% in real terms in FY24. Urban demand remained robust, with indicators like domestic passenger vehicle sales and air passenger traffic showing strength. Rural consumption also picked up pace, contributing to overall demand growth.
- Investment Demand: Gross Fixed Capital Formation (GFCF) continued to rise, supported by a private capex upcycle aided by government capital expenditure. Private non-financial corporations’ GFCF increased by 19.8% in FY23, with sustained momentum in FY24.
Housing and Real Estate:
- Record Housing Sales:
Urban households contributed significantly to capital formation, with residential real estate sales reaching their highest levels since 2013. The first quarter of 2024 saw record-breaking sales of 1.2 lakh units, indicating strong demand and sustained momentum in housing investments.
Banking and Financial Sector:
- Credit Growth: The banking sector, with cleaner balance sheets and adequate capital buffers, continued to support investment demand. Credit disbursal to industrial MSMEs and personal loans for housing surged, indicating strong financial support for economic activities.
Trade and Net Exports:
- Balanced Trade Performance: While merchandise export growth slowed, the overall drag on GDP was reduced by a surplus in services trade. The rise in fixed investment more than compensated for the subdued contribution from net exports.
Economic Recovery and Growth Trajectory:
- Pre-Pandemic Trajectory: – By FY24, GDP reached levels projected by the pre-pandemic trajectory. The growth momentum allowed the economy to catch up with its pre-pandemic trend without stoking inflationary pressures, setting the stage for surpassing previous growth projections.
Macroeconomic Stability Safeguards Growth
Key Macroeconomic Indicators
- Macroeconomic Indicators: Focus on macroeconomic stability was crucial, with measures such as controlling inflation, managing the current account deficit, and ensuring adequate liquidity. Fiscal consolidation efforts led to a decline in the fiscal deficit from 6.4% to 5.6% of GDP in FY24.
Improving Public Finances
1. Consolidation of Union Government Finances
- Fiscal Deficit Reduction: The Union Government reduced its fiscal deficit from 6.4% of GDP in FY23 to 5.6% in FY24. This improvement was driven by robust growth in both direct and indirect taxes, reflecting resilient economic activity and increased compliance.
- Revenue Receipts: Higher-than-budgeted non-tax revenue, including dividends from the RBI, bolstered revenue receipts, contributing to a lower fiscal deficit. The revenue deficit narrowed, allowing a larger share of the fiscal deficit to be allocated to capital outlay, improving the productivity of borrowed resources.
2. Buoyancy in Revenues Continues in FY24
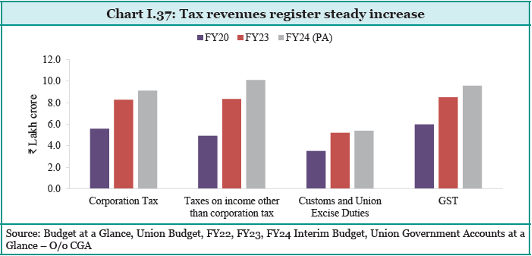
- Growth in Gross Tax Revenue: Gross tax revenue (GTR) increased by 13.4% in FY24, driven by a 15.8% growth in direct taxes and a 10.6% rise in indirect taxes. This resulted in a tax revenue buoyancy of 1.4.
- Efficiency in Tax Collection: The efficiency of tax collection improved, with the cost of collecting direct taxes declining from 0.66% of gross collections in FY20 to 0.51% in FY23.
- GST Collections: GST collection grew by 12.7% in FY24, reflecting increased compliance and economic activity. The generation of GST E-way bills also registered an uptick, indicating robust trade activity.
3. Trends in Central Government Expenditure
- Capex Increase: Capital expenditure for FY24 stood at ₹9.5 lakh crore, an increase of 28.2% year-on-year. This figure is 2.8 times the level of capex in FY20, demonstrating a strong commitment to infrastructure development.
- Sectoral Focus: Government capex targeted critical sectors such as road transport, highways, railways, defence services, and telecommunications, addressing logistical bottlenecks and expanding productive capacities.
- Grants-in-Aid: Significant grants-in-aid for the creation of capital assets were disbursed to states, incentivizing them to increase their productive spending.
4. Capex Has Lifted the Productive Potential of the Economy; Time for the Private Sector to Take the Baton
- Government Capex Impact: The government’s thrust on capex has been a critical driver of economic growth amidst a challenging global environment. The focus on broad-based spending has addressed logistical bottlenecks and expanded productive capacities.
- Crowding-In Private Investment: Government capex has begun to crowd in private investment. Data indicates that private investment across a consistent set of over 3,200 listed and unlisted non-financial firms grew by 19.8% in FY24.
- Housing Sales: Urban households contributed significantly to capital formation, with residential real estate sales reaching their highest levels since 2013, indicating strong demand and sustained momentum in housing investments.
5. Revenue Expenditure Growth Remains Restrained
- Efficient Management: Total expenditure for FY24 was lower by ₹60.6 thousand crore compared to budgeted estimates, without compromising essential areas such as rural development and education.
- Subsidy Reduction: Expenditure on major subsidies declined by 22.1% year-on-year, driven by reductions in fertilizer and food subsidies as supply chains adapted and prices returned to pre-conflict levels.
- Interest Payments: Efficient expenditure management and lower borrowing costs led to a marginal downward revision of budgeted expenditure on interest payments.
6. Overview of State Government Finances
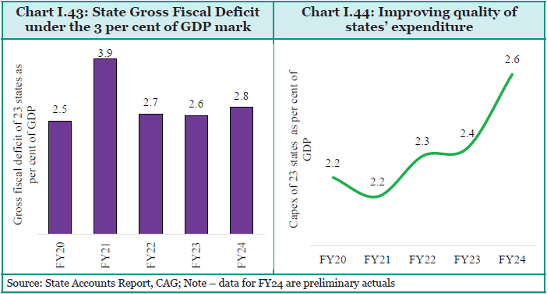
- Improved State Finances: State governments improved their finances, with preliminary unaudited estimates showing a gross fiscal deficit of 2.8% of GDP for a set of 23 states, lower than the budgeted 3.1%.
- Focus on Capex: The quality of spending by state governments improved, with a focus on capital expenditure.
- Progressive Transfers: The Union Government’s transfers to the states are highly progressive, enabling poorer states to incur greater public spending relative to their GSDP, addressing regional imbalances.
7. General Government Debt
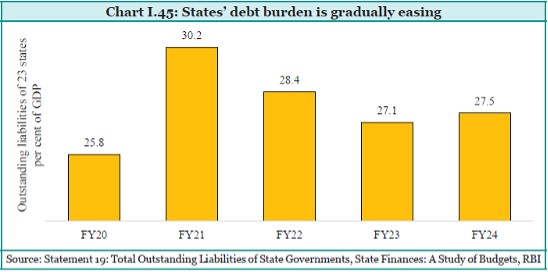
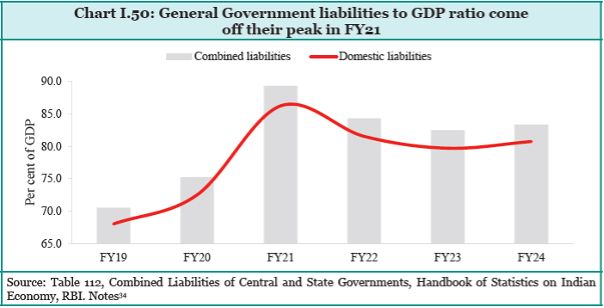
- Declining Debt Trajectory: The Union and State Governments focused on fiscal consolidation, reflected in the declining debt trajectory until FY23. However, the general government debt to GDP ratio slightly increased in FY24 due to higher interest rates and lower nominal GDP growth.
- Low Risk Characteristics: Union Government debt is characterized by low currency and interest rate risks, with almost all external borrowings from official sources. The weighted average maturity of the outstanding stock of dated securities increased, reducing rollover risks.
- Improved Credit Ratings: S&P Global Ratings upgraded India’s sovereign credit rating outlook from ‘stable’ to ‘positive’ in May 2024, reflecting robust economic growth and improved fiscal metrics.
Conclusion
India’s commitment to improving public finances through fiscal consolidation, efficient expenditure management, and enhanced revenue generation has laid a strong foundation for sustainable economic growth. The focus on capital expenditure, progressive state transfers, and prudent debt management are key elements driving this financial resilience.
Inclusive Growth
Inclusive growth in India focuses on equitable distribution of economic benefits across all sections of society, ensuring that no one is left behind. The core initiatives and achievements in this domain include:
- Social Welfare Programs: Various schemes such as the Swachh Bharat Mission, Jan Dhan Yojana, and PM-AWAS Yojana have significantly improved the lives of the underprivileged by enhancing capabilities and providing better opportunities.
These initiatives have led to substantial improvements in sanitation, financial inclusion, and housing.
- Targeted Reforms for Last-Mile Delivery: Programs like the Aspirational Districts Programme, launched in 2018, aim to uplift the most backward regions. Inspired by its success, the Aspirational Blocks Programme was introduced in 2023.
Additionally, the Vibrant Villages Programme focuses on border areas, and the Viksit Bharat Sankalp Yatra saw massive participation, indicating the government’s commitment to inclusive development.
- Digitization of Services: The digitization of healthcare, education, and governance ensures more efficient use of resources and better service delivery. The Direct Benefit Transfer (DBT) scheme and the Jan Dhan Yojana-Aadhaar-Mobile (JAM) trinity have been instrumental in this transformation, ensuring that benefits reach the intended recipients directly.
- Employment and Labor Force Participation: According to the annual Periodic Labour Force Survey (PLFS), the all-India annual unemployment rate for persons aged 15 years and above has been declining since the pandemic.
This decline is accompanied by a rise in the labor force participation rate and the worker-to-population ratio. Employment has recovered in both urban and rural areas, with improvements noted across gender and age groups.
- Impact on Women and Youth: Employment rates among women and youth have shown significant improvements, contributing to overall economic stability and growth. Initiatives focusing on skill development and entrepreneurship have empowered these groups, ensuring their active participation in the economy.
Summary
The Indian economy demonstrated resilience amidst global challenges, maintaining strong GDP growth and balanced sectoral performance. Macroeconomic stability measures ensured minimal impact from global uncertainties. Fiscal consolidation and efficient public finance management contributed to robust revenue growth and increased capital expenditure, laying the foundation for sustained economic growth.

