CHAPTER 4 – EXTERNAL SECTOR: STABILITY AMID PLENTY
Foreign investments have slowed due to political uncertainties, higher interest rates in developed countries, and active industrial policies in these regions.
- For instance, the U.S. Inflation Reduction Act has incentivized investment to remain domestic while attracting capital from other regions.
- According to UNCTAD, global FDI decreased marginally by 2% to $1.3 trillion in 2023.
- Global trade has also slowed, with the value of world merchandise trade declining by 5% in 2023.
- In Emerging Markets and Developing Economies (EMDEs): External debt as a percentage of GDP increased from 26.2% in 2012 to 29.8% in 2023. EMDEs maintained a current account surplus in both 2022 and 2023, although it moderated from 1.5% of GDP in 2022 to 0.6% of GDP in 2023.
- Advanced Economies (AEs) moved from a current account deficit in 2022 to a surplus in 2023.
Changing Global Trade Dynamics
Shifting Trade Patterns
- Shift in Energy Market: Shifted energy imports from Russia to Norway and the US; EU’s pipeline gas imports from Russia declined from 150.2 billion cubic meters in 2021 to 42.9 billion cubic meters in 2023, while imports from the US rose from 18.9 billion cubic meters to 56.2 billion cubic meters.
- US-China Dynamics: US companies have been trying to de-couple/de-risk themselves from China with practices like reshoring, nearshoring, and friend-shoring. However, the US still remains reliant on Chinese inputs, with Chinese firms re-routing supply through countries like Mexico and Vietnam. For example:
- Mexico became the largest goods trade partner of the US in 2023, surpassing China with a total trade of $798 billion.
- Vietnam Increased trade with both China and the US; Vietnam’s exports to the US more than doubled to $114 billion in 2023, while its imports from China rose from $58 billion to $111 billion in the same period.
- Declining Global Trade Trends
- Trade Volume: Contracted by 1.2% in 2023 after a 3% expansion in 2022.
- Merchandise Trade: Declined by 5% in 2023 due to lower prices, offset by a 9% increase in trade in commercial services.
- Digitally Delivered Services: Global exports rose by 9% to $4.3 trillion in 2023, making up 13.8% of world exports of goods and services.
Global Economic Challenges and Risks
- Geopolitical Tensions: Such as Ongoing tensions in Ukraine, developments in the Middle East, and the Red Sea crisis, creating supply chain disruptions. Additionally, around 64 countries, representing about 49% of the world population, including the EU, will hold elections in 2024. The policy uncertainty, especially regarding international trade and immigration, could limit trade rebound scope.
- Food and Energy Prices: Potential spikes due to geopolitical events and climate disturbances.
- Restrictive Trade Practices: Leading to higher prices and complex supply chains.
- Shipping Route Disruptions:
- Panama Canal is operating at partial capacity due to freshwater shortages, impacting 6% of global trade and over 70% of US traffic.
- Suez Canal, handling about 12% of global trade and one-third of Asia-Europe container shipping; traffic diversion has increased journey times and fuel costs, leading to higher container shipping rates and a declared hike in transit fees.
Future Projections
- Trade Growth: World merchandise trade volume is expected to grow by 2.6% in 2024 and 3.3% in 2025 as demand rebounds.
- Positive Trends: UNCTAD reports indicate a positive turn in global trade trends in early 2024, with increased exports from China (9%), India (7%), and the USA (3%).
- India is expected to benefit from its broad and diversified trade relationships with Asia, Europe, and the US despite the global trade disruptions. The following section will discuss India’s trade performance in detail.
India’s Trade: Resilience Amidst Global Turmoil
Contribution to Economic Growth
- Increased Trade Share: Through reforms and measures to enhance trade, India has seen a significant increase in the share of trade (goods and services) in GDP.
- Trade Openness Indicator: Rose from 37.5 in FY05 to 45.9 in FY24, facilitating efficient resource allocation through comparative advantage.
- Trade Share in GDP: Excluding petroleum products exports and crude oil imports, the share rose from 32.3% in FY05 to 40.8% in FY23.
Global Market Share
- Goods Exports: India’s share in global goods exports increased to 1.8% in FY24, up from an average of 1.7% during FY16-FY20.
- Services Exports: The share rose to 4.3% in FY23 from an average of 3.3% during FY16-FY20, indicating a significant gain in market share in global exports of goods and services.
India’s Overall Trade: Resilience Amidst Global Turmoil
- Exports Growth: India’s overall exports (merchandise and services) showed consistent growth since FY17, with a significant turnaround in FY22 after an economic slowdown in FY20 due to the pandemic.
- FY23 Performance: Overall exports crossed $776 billion, and imports increased to $898 billion from $760.1 billion in FY22.
- FY24 Trends: Despite global challenges, overall exports in FY24 slightly grew by 0.23%, while overall imports declined by 4.9%. In the first two months of FY25, exports increased to $133.6 billion, and imports rose to $149.9 billion, widening the trade deficit from $14 billion to $16.3 billion.
Merchandise Trade
Exports and Imports:
- Merchandise exports contracted in 2023 due to geopolitical tensions but showed positive growth in H2 FY24.
- Imports: Witnessed positive growth in H2 FY24 despite a decline in overall value due to falling global commodity prices.
- Trade Deficit: Narrowed to $238.3 billion in FY24 from $264.9 billion in FY23.
Resilient Sectors:
- Non-petroleum and Non-gems & Jewellery: Exports rose by 1.5% to $320.2 billion in FY24, while imports in this category contracted by 3.5%.
- Composition Shift: The share of capital goods in exports rose from 16.3% in FY23 to 18.9% in FY24, indicating improved industrial capacities. The share of consumer goods and intermediate goods declined.
Regional Diversification of Exports
- Declining Share of Top Destinations: The share of the top 10 countries in India’s merchandise exports fell from 61.9% in FY2000 to 50.5% in FY24.
- Emerging Export Destinations: Post-FY2000, countries like the UAE, Singapore, Hong Kong, and China became major export destinations, replacing traditional partners like the UK, Germany, and Belgium.
- Asia and Africa: The combined share of these developing regions in total exports rose from 42.9% in FY2000 to 52% in FY24. Major export partners in FY24 included the UAE, Singapore, China, Russia, and Australia.
| Product-Specific Success Stories in Boosting Exports |
|
Toy Exports
Defence Exports
Footwear Exports
Smartphone Exports
|
Sectoral Trends in India’s Trade
POL (Petroleum, Oil, and Lubricants) Exports:
- Decline in Value: Despite an increase in the volume of POL exports from 99 million tonnes in FY23 to 108 million tonnes in FY24, the value declined by 13.7%, from $97.5 billion to $84.2 billion, primarily due to a decrease in global petroleum product prices.
- Long-term Growth: Over six years, POL exports increased by 80.8%, from $46.6 billion in FY19 to $84.2 billion in FY24. India’s share in global POL exports rose from 4.3% in 2018 to 4.8% in 2022.
Non-POL Products:
- Increased Exports:
- Engineering Goods: Maintained dominance in merchandise exports with a consistent share of 25%, reaching $109.3 billion in FY24.
- Electronic Goods: India’s share in global electronics exports improved from 0.63% in 2018 to 0.88% in 2022, with the sector’s share in India’s merchandise exports rising from 2.7% in FY19 to 6.7% in FY24.
- Drugs and Pharmaceuticals: The share grew from 5.8% in FY19 to 6.4% in FY24, with exports increasing from $19.1 billion in FY19 to $27.9 billion in FY24.
- Declined Exports:
- Agriculture and Allied Products: Peaked at $52.7 billion in FY23 before slightly declining to $48.3 billion in FY24, holding around 11% share.
- Chemicals and Plastics: Increased in value from $31 billion in FY19 to $37.5 billion in FY24, but the share declined from 9.4% to 8.6%.
- Textiles: Declined from $37.5 billion in FY19 to $34.8 billion in FY24, with the share dropping from 11.4% to 8%.
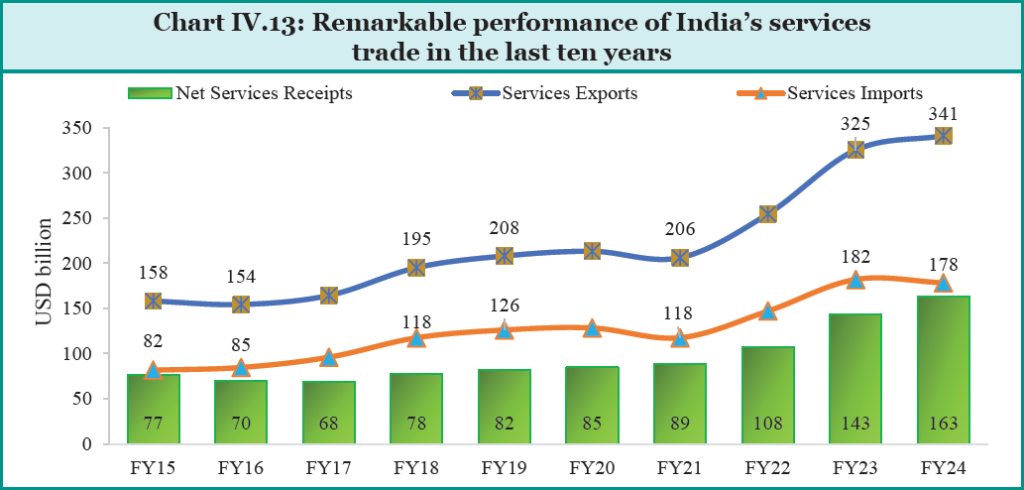
Merchandise Imports: Trends and Composition
Merchandise imports decreased by 5.7%, from $716 billion in FY23 to $675.4 billion in FY24, despite high domestic demand driven by strong economic growth.
April-May 2024: Imports increased from $106.5 billion in April-May 2023 to $116 billion in April-May 2024, indicating rising domestic demand.
Key Shifts in Composition:
- Capital Goods: Increased imports indicate heightened demand for machinery, equipment, and other durable goods, suggesting potential investments in industrial infrastructure or technological upgrades.
- Consumer Goods: A marginal increase in the share reflects a stable but limited rise in the importation of finished products for direct consumption.
- Intermediate Goods: A slight rise in the share reflects the continued need for semi-finished products, components, or materials used in further manufacturing processes.
Services as a Shining Star in Exports
Impressive Growth in Services Exports:
- CAGR of Services Exports: India’s services exports have expanded at a robust Compound Annual Growth Rate (CAGR) of over 14% over the past 30 years (1993-2022), significantly outpacing India’s merchandise export growth (10.7%) and the global services export growth (6.8%).
- Global Ranking and Share: India’s share in global services exports has risen remarkably from 0.5% in 1993 to 4.3% in 2022. India is now the seventh-largest services exporting country globally, up from the 24th position in 2001.
Sectoral Rankings in Services Exports:
- Telecommunication, Computer, and Information Services: 2nd in the world.
- Personal, Cultural, and Recreational Services: 6th.
- Other Business Services: 8th.
- Transport Services: 10th.
- Travel Services: 14th.
Balance of Payments:
The robust and steady growth in services exports has significantly strengthened India’s BoP position by offsetting a substantial part of the country’s merchandise trade deficit.
Transformation in Services Export Composition:
- Early 2000s: The period was marked by business process outsourcing (BPOs) providing cost-cutting back-end IT services.
- 2020s: India has transitioned to providing upstream and high-value-added services in law, IT, and management.
- Growth of GCCs: The Russia-Ukraine conflict and global inflation, which pressured wages, encouraged global players to set up their back-office operations in India to balance their cost model. This led to a sudden proliferation of GCCs in India.
- Contribution to Services BoP: The rise of GCCs is reflected in the BoP, with ‘Other Business Services’ being the second-largest contributor to services exports in FY24 (26%), following IT services (48%).
Shift in Services Exports:
- Software Exports: The share of software exports in overall services exports declined from 50% in FY21 to 48% in FY24.
- Other Business Services: These services have shown a rising contribution to overall services exports, achieving a CAGR of 18% between FY20 and FY24.
| Global Capability Centres (GCCs): |
|
GCCs provide bespoke services in operations, product development, and innovation across IT, BPO, engineering, and software product development service lines. Industry Verticals: Key sectors include banking and financial services, software, telecom, semiconductors, aerospace, automotive, oil and gas, healthcare, and pharma. Origin and Growth of GCCs:
Government Support:
Partnership with Startups:
Rising Global Demand:
GCCs currently contribute more than 1% of India’s GDP, with expectations for this share to grow. To attract more global players, the government needs to simplify entry processes, identify new business models, and emphasize trust and data security. |
India’s Rising Global Value Chains (GVC) Participation
GVCs involve international production sharing, where operations spread across multiple countries to produce a complex product.
- Hyperglobalisation Period: The early 2000s saw rapid GVC expansion, leading to significant trade gains, reduced supply chain costs, and deeper trade interlinkages.
- Slowbalisation: Post the 2008 global financial crisis (GFC), there was a slowdown in GVC growth due to the China-USA trade war, COVID-19, and the Russia-Ukraine conflict.
- Recent Trends: The WTO’s GVC Development Report 2023 indicates a recovery in GVCs, with increased foreign export inputs and participation rates globally.
India’s GVC Participation:
- Historical Trend: India’s GVC participation rose from the 1990s to 2009, with foreign value-added content in exports increasing from 10% in 1995 to 22% in 2009, second only to China among BRICS nations.
- Post-GFC Decline: After the GFC, India’s GVC participation declined but has begun to rise again recently.
- Recent Boost: Incentives through schemes like the Production Linked Incentive (PLI) and Districts as Exports Hub (DEH) have revitalized India’s GVC participation.
Opportunities for India:
- Primary Beneficiaries: Asia, especially India, is the primary beneficiary of shifting supply chains.
- India’s large domestic consumer market attracts foreign firms to set up operations.
- Increased Investments: Enhanced global supply chain participation is seen in increased foreign investments in sectors such as electronics, apparel, toys, automobiles and components, capital goods, and semiconductor manufacturing.
- Interest from Firms: Out of 130 firms, 28 have shown interest in setting up or expanding production facilities in India, followed by Vietnam, Mexico, Thailand, Malaysia, and Indonesia.
- Apple: Assembled 14% of its global iPhones in India in FY24.
- Foxconn: Invested in Karnataka and Tamil Nadu for new manufacturing plants.
Trends in India’s GVC Participation and Sectoral Composition
According to the WTO’s World Integrated Trade Solutions (WITS) database, India’s GVC-related trade increased from $62.9 billion in 2010 to $233.1 billion in 2022.
Growth Rate: The GVC trade grew at a CAGR of:
- 6.9% between 2010 and 2014
- 13.3% between 2014 and 2018
- 14.6% between 2018 and 2022
Sectoral Changes:
Manufacturing Sector:
- Decline in Low-Technology Manufacturing: There has been a notable decline in the share of low-technology manufacturing.
- Rise in Medium and High-Technology Manufacturing: This includes industries such as coke and petroleum, transport equipment, and primary and fabricated metals.
Services Sector:
- IT and Technology-Enabled Services: Lead India’s GVC services exports.
- Transition to High-Value Services: Shift from low-value-added business process outsourcing (BPO) to high-value-added services, such as those provided by global capability centres (GCCs).
Changes in GVC Participation:
- Backward Participation:
- Increased from 13.8% in 2019 to 16.3% in 2022.
- Notable sectors: food and beverages, electrical and optical equipment, and financial intermediation.
- Even excluding coke, refined petroleum, and nuclear fuel, backward participation rose from 12.1% in 2019 to 14% in 2022.
- Forward Participation:
- Declined from 19.1% in 2016 to 17.6% in 2022.
- Notable sectors: retail trade, coke, refined and nuclear fuel, chemicals, primary and fabricated metals.
- Economic Benefits of Increased Backward Participation: Higher backward GVC participation leads to:
- Increased gross exports.
- Greater domestic value-added.
- Higher employment levels.
- Current Status: India’s GVC participation (40.3% of gross trade in 2022) is lower than:
- USA (43.7%)
- UK (47.8%)
- Japan (46.6%)
- South Korea (56.2%)
- Malaysia (60%)
Recommendations for Enhancing GVC Participation:
- Develop Trade Infrastructure: Improve quality and efficiency.
- Integrate MSMEs: Encourage micro, small, and medium enterprises to join the GVC network.
- Simplify Procedures: Make entry and exit processes for small businesses easier.
- Trade Facilitation Measures: Implement policies to enhance trade facilitation.
- Global Mercantilism: Despite a global trend towards mercantilism, there is potential for collective country blocs to engage in intensive trade, promoting self-reliance and shared trade gains.
| Indian Districts as Export Hubs |
|
The Districts as Export Hubs (DEH) initiative was launched in August 2019.
Key Events and Successes:
Broader Goals and Approach:
E-Commerce Exports: Collaborations:
|
Changing Landscape of India’s Global Trade Arrangements
The global economy faces uncertainties due to geopolitical conflicts and policy changes. India advocates for a rule-based international trading system with WTO at its core, using Free Trade Agreements (FTAs) as tools for trade liberalization.
FTAs Signed (2021-2024): Mauritius (February 2021), UAE (February 2022), Australia (April 2022), and EFTA (March 2024).
India-Mauritius CECPA:
- Trade Growth: India’s exports to Mauritius grew significantly, with trade reaching $554.5 million in FY23.
- Agreement Details: Covers trade in goods, services, rules of origin, and technical barriers.
- Benefits: Indian exports include foodstuffs, beverages, and agricultural products; Mauritius gains access to products like frozen fish, speciality sugar, and mineral water.
- Service Access: Indian service providers access 115 sub-sectors; Mauritius accesses 95 sub-sectors.
India-UAE CEPA:
- Major Trade Partner: UAE has been among India’s top three trade partners for two decades.
- Trade Value: Bilateral trade reached $83.7 billion in FY24.
- Benefits: Preferential access for Indian products like gems, jewellery, and fuel; expected to boost bilateral trade to $100 billion in goods and $15 billion in services.
- Pharmaceuticals and Digital Trade: Facilitates access to Indian pharmaceuticals and includes digital trade provisions.
India-Australia ECTA:
- Trade Complementarity: Significant trade potential despite initially smaller trade volumes.
- Trade Growth: Bilateral trade increased to $26 billion in FY23.
- Benefits: Immediate market access at zero duty to 98.3% of tariff lines; opens investment avenues in services like telecom and health.
India-EFTA TEPA:
- First European FTA: Engages Switzerland, Norway, Iceland, and Liechtenstein.
- Significance: Signals India’s commitment to trade liberalization.
- Coverage: Comprehensive agreement covering goods, services, and bilateral investments.
Ongoing and Future FTA Negotiations:
- Notable FTAs Under Negotiation: India-UK FTA, India-EU FTA, India-Australia CECA, India-Peru Trade Agreement, India-EAEU FTA, and India-Sri Lanka ECTA.
- Review Process: Existing FTAs with South Korea and ASEAN are under review based on inter-ministerial and industry consultations.
Government Initiatives on Trade Facilitation & Logistics
Enhancing Trade Capacity and Reducing Logistics Costs:
- Export Targets and Credit:
- Set export targets and monitor progress.
- Provide export credit insurance for short, medium, and long-term exports.
- Encourage banks to offer affordable export credit to MSMEs to explore new markets.
- Streamlining Trade Processes:
- Initiatives like Turant Customs, Single Window Interface for Facilitation of Trade (SWIFT), pre-arrival data processing, and e-Sanchit enhance transparency and cooperation among stakeholders.
- CBIC’s technological initiatives include electronic cash ledger implementation, online submission of IFSC codes, use of electronic certificates of origin, and electronic repair services outsourcing.
- Postal Services:
- Department of Posts developed a Postal Bill of Export Automation System for electronic filing and processing.
- The CBIC and DoP partnership launched the Hub and Spoke Model to simplify export processes, promoting small-scale exporters through India’s postal network.
Boosting Efficiency and Lowering Logistics Costs:
- PM GatiShakti National Master Plan and National Logistics Policy (NLP):
- Launched to boost efficiency and lower logistics costs.
- Digital reforms like Unified Logistics Interface Platform (ULIP) and Logistics Data Bank enhance logistics performance.
- Digital Reforms and Infrastructure Development:
- Over 614 industry players registered on ULIP, with multiple companies submitting use cases and making applications live.
- Initiatives like railway track electrification, reduced release times by the Land Ports Authority of India, and the launch of NLP Marine improve logistics.
- Improvement in Rankings:
- India’s performance in UNESCAP’s Global Survey on Digital and Sustainable Trade Facilitation improved to 93.5% in 2023.
- Significant improvements in areas like Transparency, Formalities, Institutional Arrangement and Cooperation, and Paperless Trade.
- Women’s participation in trade facilitation increased from 66.7% in 2021 to 77.8% in 2023.
- National Time Release Study (2023):
- Conducted by CBIC, showing a 20% improvement in overall average import release time.
- Capacity improvement: Maximum improvement was reported by Mundra Seaport (33%), Hyderabad Air Cargo Complex (44%), and Tughlakabad Inland Container Depot (23%).
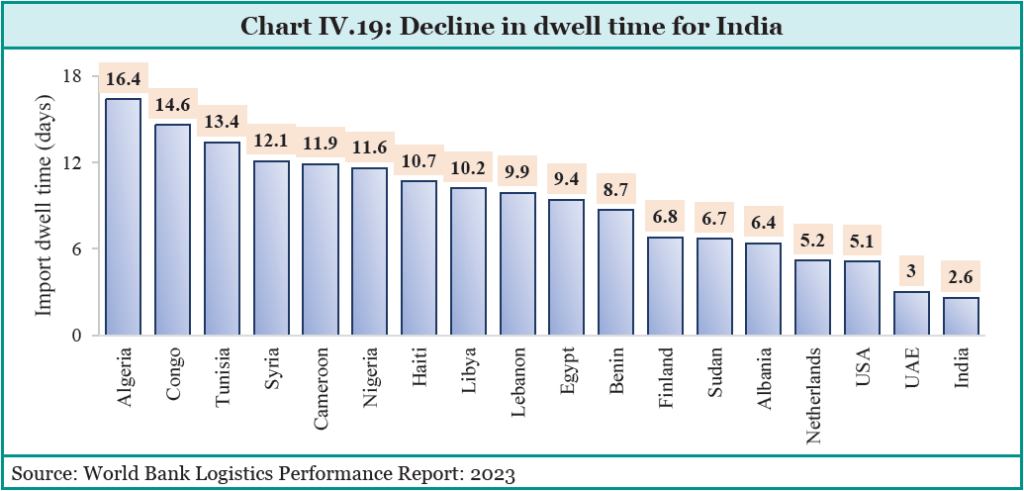
- World Bank’s Logistics Performance Index (LPI):
- India’s rank improved to 38th in 2023 from 44th in 2018.
- The introduction of cargo tracking reduced dwell time significantly in ports like Visakhapatnam.
- India aims to be within the top 25 countries on the index by 2030.
- India’s dwell time is better than even the USA and Finland.
- Sagarmala Scheme:
- Promotes port-led development utilizing India’s coastline and navigable waterways.
- Aims to increase port capacity to over 10,000 MTPA by 2047.
- Cargo movement through waterways increased by 7.5% from April to November 2023.
- Goods and Services Tax (GST):
- Reduced logistics costs by ensuring trucks do not wait at state borders, reducing travel time by up to 30%.
- Increased average distance travelled by trucks, contributing to ease of doing business and growth in manufacturing.
- Logistics costs in the economy declined by 0.8 to 0.9 percentage points of GDP between FY14 and FY22.
- State-Level Improvements:
- 2023 Logistics Ease Across Different States (LEADS) highlights positive shifts in logistics performance.
- States and UTs initiated multiple reforms, such as formulating logistics policies and developing supporting infrastructure to improve their logistics ecosystems.
| Understanding Balance of Payments (BoP) |
|
The Balance of Payments (BoP) is a comprehensive record of a country’s economic transactions with the rest of the world over a specific period, typically a year. It includes all transactions between residents of the country and non-residents. The BoP is divided into three main accounts:
Note: Invisible account in the Balance of Payments (BoP) refers to the part of the current account that deals with transactions other than those involving the trade of tangible goods. It includes services accounts, income, and current transfers. 2. Capital Account: It records all international purchases and sales of assets such as money, stocks, bonds, etc.
|
Favourable Current Account Balance
Overview of Current Account Balance:
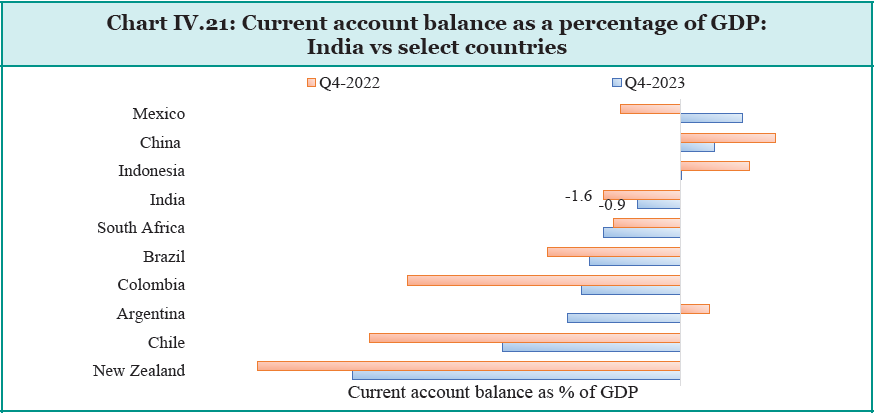
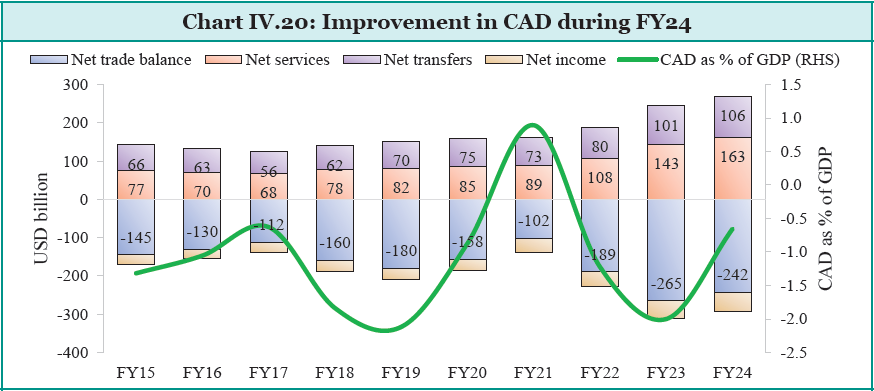
In FY24, India’s Current Account Deficit (CAD) narrowed significantly to $23.2 billion (0.7% of GDP) from $67 billion (2% of GDP) in the previous year.
Compared to other nations, India’s CAD is relatively low.
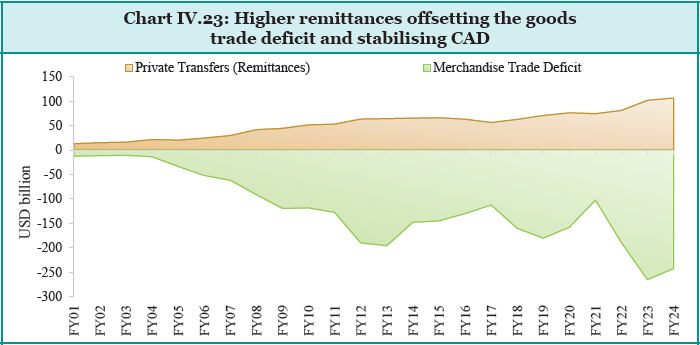
This improvement was driven by a narrowing trade deficit and increasing remittances. In Q4 of FY24, the merchandise trade deficit declined, along with the rise in net services exports and increasing remittances.
- Net services receipts increased from $143.3 billion in FY23 to $162.8 billion in FY24, primarily due to rising exports of software, travel, and business services.
- Net private transfer receipts, mainly remittances from Indians employed overseas, increased to $106.6 billion in FY24 from $101.8 billion in the previous year.
These factors contributed to a surplus in the invisible account, which cushioned the merchandise trade deficit.
Importance of Remittances:
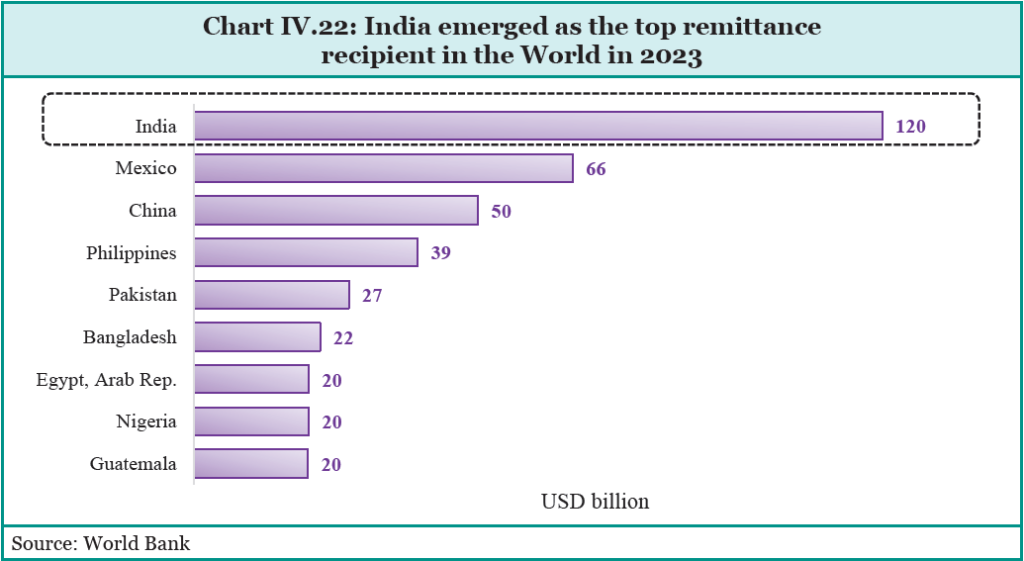
Remittances are the second-largest source of external financing after service exports, playing a crucial role in narrowing the CAD and contributing to the BoP. India, with the largest emigrant population, is the top remittance recipient country, reaching $120 billion in 2023.
Reasons for increased remittances:
- Declining inflation
- Strong labour markets in the United States and Europe,
- Demand for skilled and less-skilled workers in GCC countries.
- The agreement with the UAE to promote the use of Dirhams and Rupees for cross-border transactions also boosted remittance flows.
Remittances to India are forecasted to grow at 3.7% to $124 billion in 2024 and by 4% to $129 billion in 2025. India’s share in South Asian remittances increased to 64.5% in 2023 from 63% in 2022.
Advantages of Remittances:
- Unlike Foreign Direct Investment (FDI), which can be disinvested during financial uncertainties, remittances are a stable source of finance.
- Remittances are used directly by recipients and contribute to the nation’s growth,
- Finances the Trade Deficit: providing permanent foreign currency inflows that help finance the merchandise trade deficit and stabilize the CAD. This stability is particularly beneficial for net importers like India.
Factors Influencing Inward Remittances to India
- Economic Recovery in High-Income Countries: The recovery of job markets, particularly those in the OECD, has significantly influenced remittances to India. Employment growth post-pandemic has been more rapid for immigrants than for native-born individuals, enhancing remittance flows.
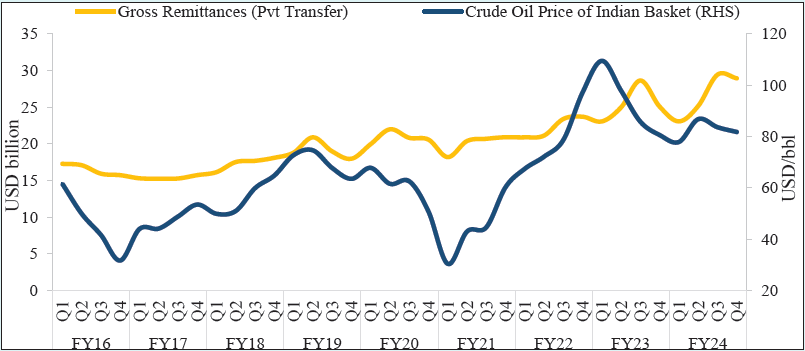
- Correlation with Oil Prices: There is a strong correlation between oil prices and remittances to India. Higher global oil prices typically lead to economic growth in oil-producing countries. This boosts the demand for migrant workers, resulting in higher remittance outflows to countries like India. Conversely, persistently low oil prices can negatively affect the remittance outflows.
- Inflation: Rising global oil prices can lead to increased inflation in India. This inflationary pressure can affect the cost of living and the economic stability of migrant workers, influencing their ability to send remittances.
- Currency Value: A weaker rupee, often a consequence of rising oil prices and increased CAD, can also impact remittance inflows. When the rupee weakens, the value of remittances in the local currency increases, potentially incentivizing higher remittance flows.
- Monetary Policy Adjustments: As per the Monetary Policy Report (October 2018), every $1 increase in the price of a barrel of crude oil could widen India’s current account deficit by $0.8 billion. Policy measures aimed at managing the CAD and stabilizing the economy can also influence remittance trends.
CAPITAL ACCOUNT BALANCE
In FY24, India saw net capital flows of $86.3 billion, up from $58.9 billion in the previous year, mainly driven by Foreign Portfolio Investment (FPI) flows and net banking capital inflows, including NRI deposits.
Foreign Portfolio Investments (FPI)
FY24 witnessed robust FPI inflows of $44.1 billion, the highest since FY15.
- Major sectors attracting equity inflows included financial services, automobiles and auto components, healthcare, and capital goods.
- Sovereign Bonds Inclusion: The inclusion of India’s Sovereign Bonds in the JP Morgan Government Bond Index-Emerging Markets is expected to drive higher debt inflows.
Foreign Direct Investment (FDI)
- Global Decline: The UNCTAD World Investment Report 2024 noted a 2% decline in global FDI to $1.3 trillion in 2023, due to weakening growth prospects, trade and geopolitical tensions, and tighter regulatory scrutiny.
- Impact on India: Net FDI inflows to India fell from $42.0 billion in FY23 to $26.5 billion in FY24, mainly due to increased repatriation/disinvestment. Gross FDI inflows remained stable, indicating continued investor interest.
Examination of FDI Trends
- FDI in Industry vs Services Sector: FDI inflows into both industry and services sectors have weakened, with the FDI-to-GDP ratio for industry falling from 0.62% in FY20 to 0.39% in FY24 and for services from 0.87% to 0.69%.
- Physical FDI vs Digital FDI: Physical FDI (e.g., automobiles, pharmaceuticals) has declined while digital FDI (e.g., computer services, telecommunications) has increased. The share of digital FDI in total FDI rose from 46.6% in FY17 to 69.2% in FY21.
- Actual FDI vs Intentions: There has been a significant increase in intentions for new sectors like renewables, AI, data centres, EVs, green hydrogen, and semiconductors. There is a strong correlation between investment intentions and actual FDI inflows.
- Sector Concentration: High FDI inflows have been concentrated in a few sectors, indicating a need for broader-based FDI across various sectors.
Continuous improvement across national, state, and local levels is required across sectors in ease of doing to attract and sustain FDI.
Competing with Advanced Nations
According to a Bloomberg article, India competes with both developing and advanced nations for FDI. India’s efforts to attract FDI must continue to evolve, addressing both traditional and new-age sectors to sustain growth and integration into global markets.
- The strategy of Advance nations: Advance nations aggressively pursue industrial policies that privilege domestic investment by dangling subsidies to businesses to prevent them from investing abroad and to entice other overseas investors who might otherwise consider emerging nations like India
- India requires a focus on political stability, policy predictability, reasonable taxes, dispute resolution mechanisms, and ease of repatriation.
- Educational and Skill Outcomes: Sustained investor interest may be driven by better educational and skill outcomes.
- Global Supply Chain Participation: Increased FDI inflows from countries like China can boost India’s global supply chain participation and exports.
China Plus One Strategy |
|
Over the past five years, many multinational companies have been looking to “de-risk” themselves from China, which has been the “world’s factory” for a long time. Companies are thus adopting a ‘China plus one’ strategy to reduce reliance on China. This shift is driven by factors like COVID-19 disruptions, US-China tensions, and rising costs in China. Companies are diversifying production to countries like Mexico, Thailand, and Vietnam. India’s possibility as China’s substitute:
India’s Strategies for Participation in Global Value Chains (GVC)
Medium-Term Focus
Limitations of China Plus One
India’s Strategic Choices
Balancing Imports and FDI: India must strike a balance between importing goods and attracting capital from China, ensuring economic stability and reducing dependency on Chinese imports. This approach aligns with global trends of mitigating risks associated with economic coercion by China. |
Comfortable Foreign Exchange Reserves
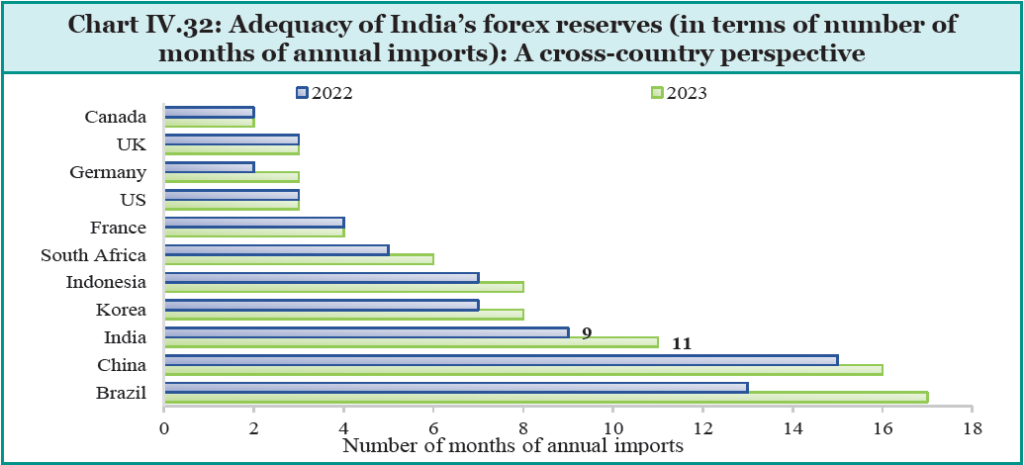
In FY24, India’s foreign exchange reserves (FER) saw a significant increase of $68 billion, the highest among major foreign exchange reserves-holding countries. These reserves act as a cushion against global economic fluctuations, providing liquidity and ensuring India can meet its external obligations.
Current Level: As of 21 June 2024, India’s FER stood at $653.7 billion, sufficient to cover more than 10 months of projected imports for FY25 and over 98% of the total external debt as of March 2024.
Exchange Rates
- Global Economic Context: Despite geopolitical risks, rising interest rates, and volatile commodity prices in FY24, the US economy remained resilient with positive indicators, drawing global funds to US treasury markets.
- Rupee’s Performance: The Indian Rupee faced depreciation pressure but remained one of the least volatile major currencies, reflecting India’s sound macroeconomic fundamentals and financial stability.
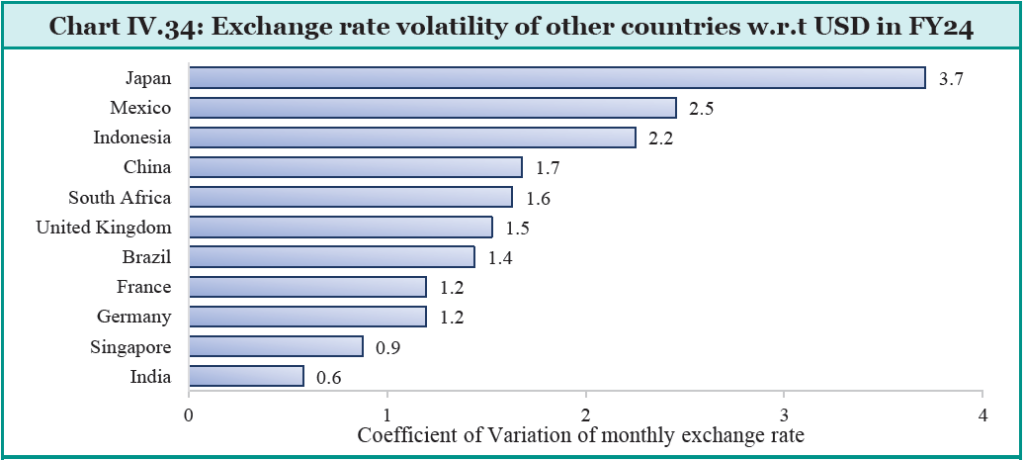
- Rupee/USD Exchange Rate: The exchange rate ranged between ₹82-83.5/USD, with the INR depreciating by 2.9% against the USD, 6.9% against the Pound Sterling, and 6.8% against the Euro in FY24. However, it appreciated by 3.5% against the Japanese Yen.
- NEER and REER: The Nominal Effective Exchange Rate (NEER) and Real Effective Exchange Rate (REER) are indicators of external competitiveness. In FY24, the NEER depreciated by 0.6%, while the REER appreciated by 0.8%. In May 2024, the NEER was at 92.2 and the REER at 104.7, showing appreciation of 0.03% and 1.2%, respectively.
RBI’s Role and Measures
- Market Determination: The INR exchange rate is market-determined. The Reserve Bank of India (RBI) intervenes only to curb undue volatility and ensure market stability.
- Regulatory Measures: To mitigate exchange rate volatility and global spillovers, the RBI announced measures to diversify and expand sources of forex funding, including revising the regulatory regime for FPI investment in debt flows.
| Trade and Financial Channels of the Exchange Rate |
|
Historically, a depreciated currency has been a key driver of export growth in India. It met the Marshall-Lerner conditions i.e. currency depreciation can stimulate an increase in net exports and improve BoP. This is known as the ‘trade’ channel of the exchange rate. However, the exchange rate also influences the external sector through a ‘financial’ channel, which can counterbalance the gains or losses made through the trade channel. Impact of a Weak Rupee:
Conversely, appreciation in domestic currencies has been shown to increase cross-border banking capital flows, with the financial channel being particularly potent in Emerging Market Economies (EMEs) like India. Can the Indian Rupee remain competitive despite capital inflows? Large financial account leads to currency appreciation: Over the past two decades, India’s FDI and equity portfolio inflows have averaged about 2.5% of GDP annually. The inflows to the capital account have grown by 65% between FY14 and FY24. This raises the question of whether the Rupee should remain competitive given India’s large and growing financial account with the rest of the world.
Findings: An auto-regressive distributed lag (ARDL) model deployed by the Economic Survey indicates that: 1. India’s trade channel is stronger than the financial channel. A 1% appreciation of the Rupee results in a net decline in the BoP by 0.54%. 2. A competitive Rupee boosts the BoP. The benefits received through the trade channel outweigh the costs incurred in the financial channel. Conclusion: India’s high trade openness and low share of external debt mean that the trade channel effect of currency fluctuations dominates the financial channel effect. This contrasts with other EMEs, where the financial channel effect is more dominant. The findings underscore the importance of maintaining a competitive Rupee to enhance India’s BoP. |
INTERNATIONAL INVESTMENT POSITION (IIP)
| The Net International Investment Position (IIP) measures whether a country is a net creditor or debtor by evaluating the difference between its external assets and liabilities. |
India’s Assets
- As of March 2024, India’s overseas financial assets were $1,028.3 billion, up 11.9% from March 2023. This increase was due to a rise in reserve assets, currency and deposits, overseas direct investment, trade credit and advances, and loans.
- Reserve assets alone, at $646.4 billion, accounted for 62.9% of India’s international financial assets.
India’s Liabilities
- India’s international liabilities stood at $1,390 billion as of March 2024, higher by 8.1% compared to March 2023. The increase was mainly in portfolio investment, loans, direct investment, and other accounts payable.
- Debt liabilities made up 51.1% of the total external liabilities.
Net claims of non-residents in India were valued at $361.7 billion as of March 2024, a decline of $5.5 billion from March 2023. India’s international financial assets covered 74% of its international financial liabilities by the end of March 2024.
STABLE EXTERNAL DEBT POSITION
External debt supports economic growth by supplementing domestic savings. India manages its external debt prudently to keep the current account deficit within sustainable limits and encourage non-debt-creating external finance.
Debt Management:
- India’s external debt to GDP ratio declined to 18.7% at the end of March 2024 from 19.0% at the end of March 2023.
- The share of short-term debt (with original maturity of up to one year) in total external debt decreased to 18.5% from 20.6%.
- Foreign exchange reserves (FER) to total debt ratio stood at 97.4% as of March 2024.
India is in a better position compared to peer countries with relatively low levels of total debt.
OUTLOOK AND CHALLENGES
India’s CAD improved significantly, ending with a surplus of 0.6% of GDP in Q4 of FY24, driven by a narrowing merchandise trade deficit, rising service exports, and resilient remittances. The CAD is expected to moderate to below 1% for FY24 due to the expansion of the PLI scheme and new FTAs, increasing the global market share of India’s exports.
Risks and Challenges
- Fall in Demand from Major Trading Partners: A decline in import volume from key partners like the USA poses risks to India’s export growth.
- Rise in Trade Costs: Disruptions in major shipping routes due to geopolitical tensions increase trade costs, affecting India’s economy.
- Commodity Price Volatility: Fluctuations in prices of critical imports can impact India’s trade balance and inflation levels.
- Trade Policy Changes: Policy changes by major trading partners or geopolitical developments can affect India’s export opportunities and market access.
Way Forward:
- India aims to balance security concerns with economic considerations by pushing towards manufacturing in complex and niche sectors through schemes like PLI and Make in India.
- The services sector remains a strong point for globalisation, with growing global demand for Indian services exports.
- Efforts to enhance logistical efficiency and strike trade agreements, such as the International North-South Transport Corridor (INSTC) and the India-Middle East Europe Corridor (IMEC), aim to bolster trade connectivity and competitiveness.
India’s focus on improving competitiveness in various product areas and fostering stronger regional trade ties is crucial. In the face of global geopolitical tensions and protectionism, enhancing the quality and stability of exports is key to turning challenges into op


