Poverty
Therefore, income, that enables consumption has always been the clear marker of poverty.
Poverty in terms of income
Poverty is often measured using income thresholds, such as the poverty line, which varies by country and is adjusted for factors like family size and cost of living.
Poverty line:
The poverty line is the minimum level of income (or consumption) that is necessary to maintain a decent standard of life.
Note: It must be understood that in a poor household, nearly all income is utilised in maintaining a basic level of consumption and therefore income is equal to consumption.
The poverty line helps determine the number of poor, which in turn helps the government and the policymakers to make adequate policies for their upliftment.
Classification of Poor
In terms of the poverty line, we can classify poverty as:
Chronic Poor
Those people who have experienced poverty for a long time, often for their whole life, are known as chronic poor. These include people who have always remained poor and also those people who sometimes can achieve decent income but are usually chronically poor.
Transient Poor:
Those people who experience poverty only sometimes, but not always. They might be:
- Churning poor: Generally, those who experience poverty seasonally, such as in dry seasons. It can also include those people who are pushed below the poverty line during the recessions.
- Occasionally Poor: Those who are almost always above the poverty line, but only occasionally, such as during economic slowdown, disaster, or an adverse event are unable to maintain a decent consumption level.
Never Poor (Non-Poor)
These individuals consistently remain above the poverty line throughout the Year. They are economically stable and do not experience poverty at any point.
Determining Poverty Line in India
| Did you know? |
| Dadabhi Naroji was the first to discuss the concept of the Poverty line. He used the menu for a prisoner to arrive at the “Jail Cost of Living”. He assumed that 1/3rd of the population is children and half of them consumed very little.; while the other half consumed half of the adult diet.
According to him, the poverty line should be as follows: Poverty line = 1/6 X nil + 1/6 X half + 2/3 X Full = ¾ X Full plate of food in Jail |
Poverty line based on Consumption:
Several attempts have been made to compute the poverty line based on the level of consumption in the Indian economy:
- In 1962, the planning commission formed a Study group to study poverty.
- In 1972, a Task Force on projections of Minimum Needs and Effective Consumption Demand was formed.
Further, Expert groups were formed in 1989 and 2005 to determine the poverty line.
Poverty line based on Calorie intake:
A person is considered poor if his or her income or consumption level falls below a given “minimum level”, necessary to fulfil basic needs.
Since the 1970s: based on desired calorie requirement. Calorie need depends on age, sex and the type of job a person does. The accepted average calorie requirement in India is:
- 2400 calories/person/day in Rural areas;
- 2100 calories/person/day in Urban areas.
Computing the poverty line:
The monetary expenditure/capita needed for buying these calorie requirements in terms of food grains etc. is referred to as the poverty line.
Consumption data is revised periodically based on sample surveys carried out by the National Sample Survey Organisation (NSSO).
According to this data, 55% of people were considered poor in 1973, 36% in 1993, and just 26% in 2000, according to that time’s formula.
Expansion of items:
Deprivations cannot be measured only in terms of calorie deficit. Deprivation of other essential items such as clothing and education must also be considered while computing the poverty line.
It takes into account a few expenditures on food and a few select items as a proxy for income.
- Cereals, pulses, vegetables, milk, oil, sugar, etc. together provide these needed calories.
- Clothing, footwear, fuel and light, educational and medical requirements etc.
Tendulkar Committee
An expert group in 2009, also referred to as the Suresh Tendulkar recommendation panel took to compute the poverty line.
The “Tendulkar Formula” approach:
- Shift from Calorie-Based Estimation: Calorie consumption did not remain the sole metric for the estimation of poverty. Instead, it emphasized a broader range of consumption items, including food (not “Calorie”), education, and healthcare, to define the poverty line.
- Uniform Poverty Line Basket (PLB): The committee recommended adopting a uniform PLB across both rural and urban areas, ensuring consistency in poverty estimation nationwide. This approach differed from previous methods that had separate baskets for rural and urban regions. However, it still used the monetary value of 2400 Calorie for a Rural person and 2100 Calorie for an Urban person to compute expenditure on food.
- Use of Mixed Reference Period (MRP): The committee advocated for using MRP-based estimates, which consider consumption data over varying reference periods, as opposed to the Uniform Reference Period (URP) used in earlier assessments.
- Private Expenditure on Health and Education was used for the first time.
According to this formula, in 2009-10, the poverty line was fixed by the government at ₹801 for rural areas and ₹1198 for Urban areas in terms of Monthly per capital Expenditure. In 2011-12, however, it was revised to ₹673 and ₹860 respectively. This lowered the poverty line. As a result, only 22% of the Indian population was considered below the poverty line.
It felt like the UPA government was trying to portray that poverty has been reduced just by playing with numbers.
Rangarajan committee
An expert group in 2014 was formed under the chairmanship of former RBI Governor Rangarajan. It aimed to provide a more realistic and updated estimate of poverty.
The Rangarajan committee revisited the Tendulkar formula:
- The energy requirement was lowered to 2,155 cal/person/day in rural areas and 2,090 cal/person/day in urban areas.
- Both consumption and nutritional needs became more comprehensive. Introduces a broader basket of goods, covering the expenses on housing, clothing, fuel, lighting and personal care products.
- It used a Modified mixed reference period estimate.
- Set a higher poverty line at ₹32 per day in rural areas and ₹47 per day in urban areas (2011-12 data).
- The poverty line was updated to the Monthly per capital expenditure of ₹972 for rural areas and ₹1407 for Urban areas spent in 2011-12.
According to the updated formula, 29.5% of people were computed below the poverty line revised from 22% (Tendulkar Formula) in 2014. http://pib.nic.in/newsite/PrintRelease.aspx?relid=108291
Poverty in India:
Extreme poverty in India
India has 32.7% of the people extremely poor (below the international poverty line of $2.15). The percentage of poor declining fast. India had 475 million below the extreme poverty line in 1981; 428 million in 2001 and nearly 129 million in 2024. By this estimate, less than 10% of Indians are extremely poor.
Based on the Monthly Per Capital Expenditure approach
As per the Rangarajan Formula (adjusted to inflation), the poverty level is less than 10% in India according to the NITI Aayog. As per the NITI Aayog, ₹1,373 was the average consumption level for the bottom 5% of rural households, while it was ₹1,782 for the next 5% of households.
Geographical distribution in India:
Poverty is a serious problem in Odisha, Bihar, Assam, Tripura and UP. In Odisha and Bihar, it is 47% and 43% respectively.
In 20 states and UT(s) poverty ratio is less than the national average.
In Kerala, JK, AP, TN, Gujarat and WB significant decline in poverty. Punjab and Haryana are traditionally not poor. In Kerala, human resource development must have helped. In AP and TN public distribution of food grains.
Poverty Indices based on Income:
Headcount Ratio
It refers to the proportion of people below the poverty line; It is popular because it is easy to understand and measure. The Poverty headcount ratio at the national poverty line (percentage of population) in India was last reported at 21.9% in 2011-12.
Definition:-When the number of poor is estimated as the proportion of people below the poverty line, it is known as the ‘headcount ratio’.
Poverty Gap Index,
It is defined as the average poverty gap in the population as a proportion of the poverty line. The extent to which individuals fall below the poverty line (the poverty gaps) as a proportion of the poverty line.
N is the total population,
q is the total population of poor who are living below the poverty line,
z is the poverty line, and
y is the income of the poor individual
Problem: The sum of these poverty gaps gives the minimum cost of eliminating poverty if transfers were perfectly targeted. The measure does not reflect changes in inequality among the poor. Severely poor people may require more than the proportional investment in skill, capabilities and personal resources.
Squared poverty gap index
It is also known as the poverty severity index average. It takes the squares of the poverty gaps relative to the poverty line. Thus the greater the distance below the poverty line, exponentially greater the value of the index.
Sen Index
- H*G + PGI*(1-G)
G is the Gini Coefficient; H is the Head count ratio; PGI poverty gap Index.
Problems with the concept of Poverty line
Earlier poverty was related to the level of income of consumption. But by definition, Poverty is deprivation. Deprivation can be looked at through other social indicators such as:
- Illiteracy level,
- Lack of general resistance due to malnutrition,
- Lack of access to healthcare,
- Lack of job opportunities,
- Lack of access to safe drinking water and sanitation.
Therefore, the concept of the poverty line as a basic level is considered highly flawed and therefore criticised by economists.
Poverty as Deprivation
From the above discussion, we have understood that considering a low level of income as a proxy for poverty can sometimes be flawed.
Amartya Sen has given a better way of understanding deprivations. He considers that the inaccessibility to resources can have three dimensions:
- Availability: the resources must be sufficient enough to meet the needs of the population sustainably. For example, aquifers must not be polluted.
- Affordability: Essential services should be within financial reach. For example, drinking water resources must not be monopolised and must be affordable.
- Accessibility: People can obtain services without any physical, social, or other limitations. For example, caste should not act as a barrier to accessing public wells.
Together, these principles form a framework for evaluating welfare policies, promoting inclusive development, and reducing poverty by addressing economic and social inequalities.
Analysis based on social inclusion and vulnerability:
Social exclusion:
Exclusion from the prevailing social system and its rights and Privileges.
Poor having to live only in a poor surrounding with other poor people, excluded from enjoying the social equality (of facilities, benefits and opportunities) of better-off people in better surroundings.
It can both be a cause and consequence of poverty. For example, the Caste system.
Vulnerability:
Vulnerability is a measure that describes the greater probability of certain communities or individuals becoming or remaining poor in the coming years. Determined by the options available for finding an alternative living in terms of education, health and job opportunities.
They are at greater risk during natural disasters, terrorism etc. Thus, their social and economic inability to handle risk is vulnerability.
Poverty across Vulnerable groups in India
In 2000, 51% of ST, 50% of Urban casual labourers, 47% of Rural agriculture labourers, and 43% of SC were poor; Whereas the average poverty ratio was still around 26%.
Amartya Sen saw an increase in freedom as the main objective of development. It is a Utilitarian Approach, i.e. one that focuses on increasing the happiness of individuals.
Poverty indices based on real consumption
Multidimensional Poverty Index (MPI)
| Dimension | Indicators |
| Health | 1. – Child Mortality |
| 2. – Nutrition | |
| Education | 3. – Years of schooling |
| 4. – School attendance | |
| Living Standards | 5. – Cooking fuel |
| 6. – Toilet | |
| 7. – Water | |
| 8. – Electricity | |
| 9. – Floor | |
| 10. – Assets |
It is developed by the UNDP and Oxford Poverty and Human Development Initiative (OPHI).
It is computed by scoring each surveyed household on 10 parameters in three equally weighted dimensions – health, education and standard of living.
Each dimension and each indicator within a dimension is equally weighted.
Data: It utilises the National Family Health Survey (NFHS).
Global MPI 2020: India is ranked 62 and also accounted for the largest reduction in multidimensional poverty between 2005/2006–and 2015/2016.
It measures poverty based on the deprivation of households with respect to various basic amenities.
- Poor: Those who are deprived in at least 1/3rd of weighted indicators.
- It can tell about the depth of poverty. It can estimate who is likely to become poor as a result of slight additional deprivations. For Example, Environmental hazards lower the living standards & force people into poverty.
As per the MDPI, 27.5% of Indians were multidimensionally poor in 2015-16, compared to 54.7% poor in 2005-06. By this estimate, 364 million people are now poor, and about 271 million people have been pulled out of poverty between 2005 and 2016.
Human Poverty Index
It is related to HDI and measures the shortfall of Human development. It is a non-income measure. It includes:
- The extent of unemployment and functional labour skills.
- Probability of not surviving till the age of 40,
- Adult literacy rate,
- Number of people who do not have access to clean water,
- A number of small children who are underweight are taken into account to show the shortfall of human development in any region.
Often poverty Index is more revealing than the HDI.
Human Development Index
The final aim of poverty alleviation is Human Development. The basic goal of development is to create conditions where people can live meaningful lives. It must be a life with some purpose.
Amartya Sen’s Capabilities approach
Building people’s capabilities in the areas of health, education and access to resources is important in enlarging their choices (ability to make better choices). If people do not have capabilities in these areas, their choices also get limited.
- Choices are not fixed: The government should not decide the products of welfare (food subsidy etc.) because people’s choices are not fixed but keep on changing.
- Democracy: Democracy is needed for public involvement in policy-making so that their choices are taken into account.
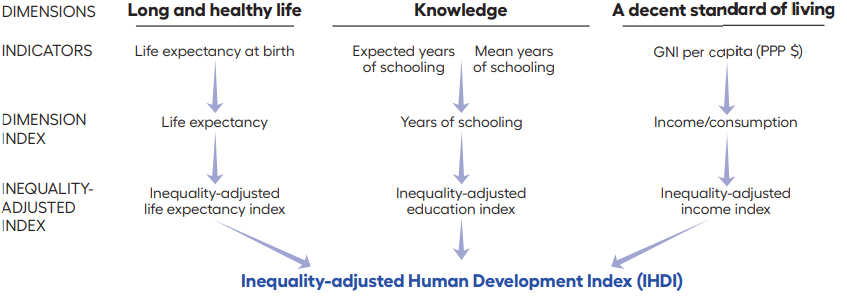
Inequality-adjusted HDI: The Atkinson Method uses a value: IALEF = 1 – GM/AM
Calculation of HDI
It takes the average of the following three indexes:
- Health access indicator or the Life Expectancy Index (LEI): It is represented by the life expectancy at birth. The higher the life expectancy, the higher the chance that people have of living longer and healthier lives. Life expected to be between 25 and 85:
- 85 means a score of 100/100
- 25 means a score of 0/100
- Knowledge indicator or the Education Index (EI): It takes an average of two indicators:
- Mean years of schooling (expected 15)
- Expected year of schooling (18 years equivalent to master’s)
- Access to Resources indicator or the Income Index (II): Measured in Purchasing power (in US Dollars): On logarithmic scale: $40,000 to $100 annual income.
The Human development index is calculated as the Geometric mean of the three indicators. It means that each of the above indicators is given a weightage of 1/3rd for the calculation of HDI.
In summary:
Other Human Development Indices
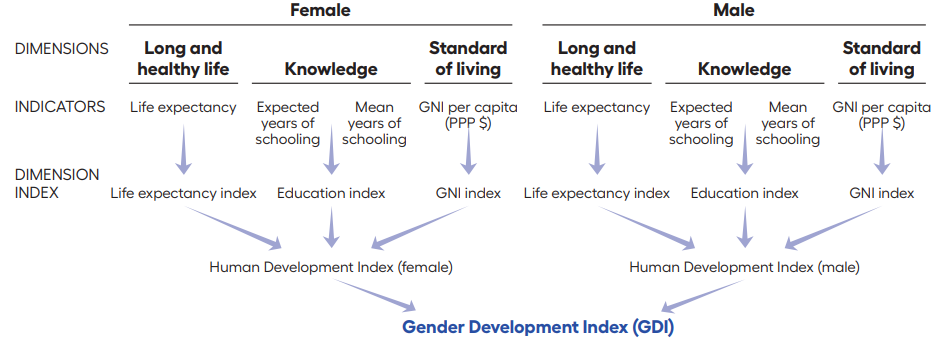
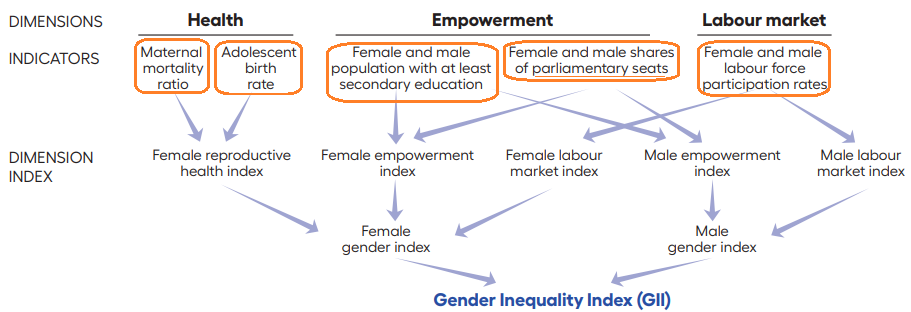
The Human Development Report (HDR) was released by the United Nations Development Programme (UNDP) and was released for the first time in the year 1990. HDR Office releases five composite indices each year:
Inequality-Adjusted Human Development Index (IHDI),
Gender Development Index (GDI),
Gender Inequality Index (GII),
Multidimensional Poverty Index (MPI)
Gini Index:
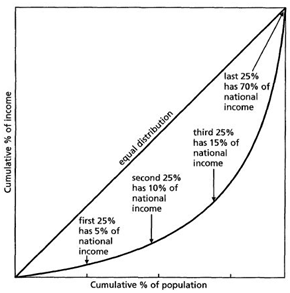 The Gini Index is an indicator of the income inequality in the society. It uses the Lorenz curve to estimate this inequality.
Lorenz curve is the graphical representation of income distribution. The y-axis represents the cumulative income in the economy, and the x-axis represents the cumulative population.
- On the Lorenz curve graph, a straight diagonal line represents perfect equality of wealth distribution;
- All real economies are represented by a curved line on the Lorenz curve. For example, say the first 25% of the population earns just 5% of the national income and so on.
The Gini coefficient is the ratio of the area between the curved line and the straight line to the area under the straight line. It correlates to the amount of inequality in the society.
- 0 perfect equality (or 0%)
- 1 perfect inequality or 100% in percentage terms.
Gini index of India: According to the World Bank, India’s Gini index was 32.8% in 2021, indicating moderate inequality.
Comparison with the world:
- Lower Inequality: Countries like Norway and Slovenia have Gini indices around 22-24, reflecting more equitable income distributions.
- Middle Inequality: Most countries lie in the middle like India. France, Japan, Germany and the UK have a Gini coefficient in the range of 32-36. Even Bangladesh belong to this group.
- Higher Inequality: Nations such as South Africa and Brazil exhibit Gini indices above 50%, indicating significant income disparities. China and the USA have a Gini index in the range of 47-49.
The low Gini coefficient is not a reflection of a developed or wealthy society. For Example, Pakistan has a Gini coefficient of 29%. However, it tells about the economic interactions within the society and the power disparity.

